Polygon may bounce up at $0.49
Polygon (MATICUSD) Price Analysis –28 August
Before attempting to cross the $0.64 and $0.70 resistance levels, Polygon must first overcome the $0.56 resistance level. If sellers are successful in uniting their forces, the market may move past the $0.49 support level and be exposed to the $0.33 and $0.25 levels.
Key Levels:
Resistance levels: $0.56, $0.64, $0.70
Support levels: $0.49, $0.33, $0.25
MATIC/USD Long-term Trend: Bearish
The outlook for MATIC/USD over the long run is bearish. The double bottom chart pattern of the price action produced the desired outcome at $0.87. In other words, during the three-week price increase, sellers stepped in to stop purchasers from going above the $0.87 threshold. After the bullish momentum failed, the bears gained more sway and were able to push the price back down to its prior low. The funding level of $0.56 is being penetrated by Polygon at this time.
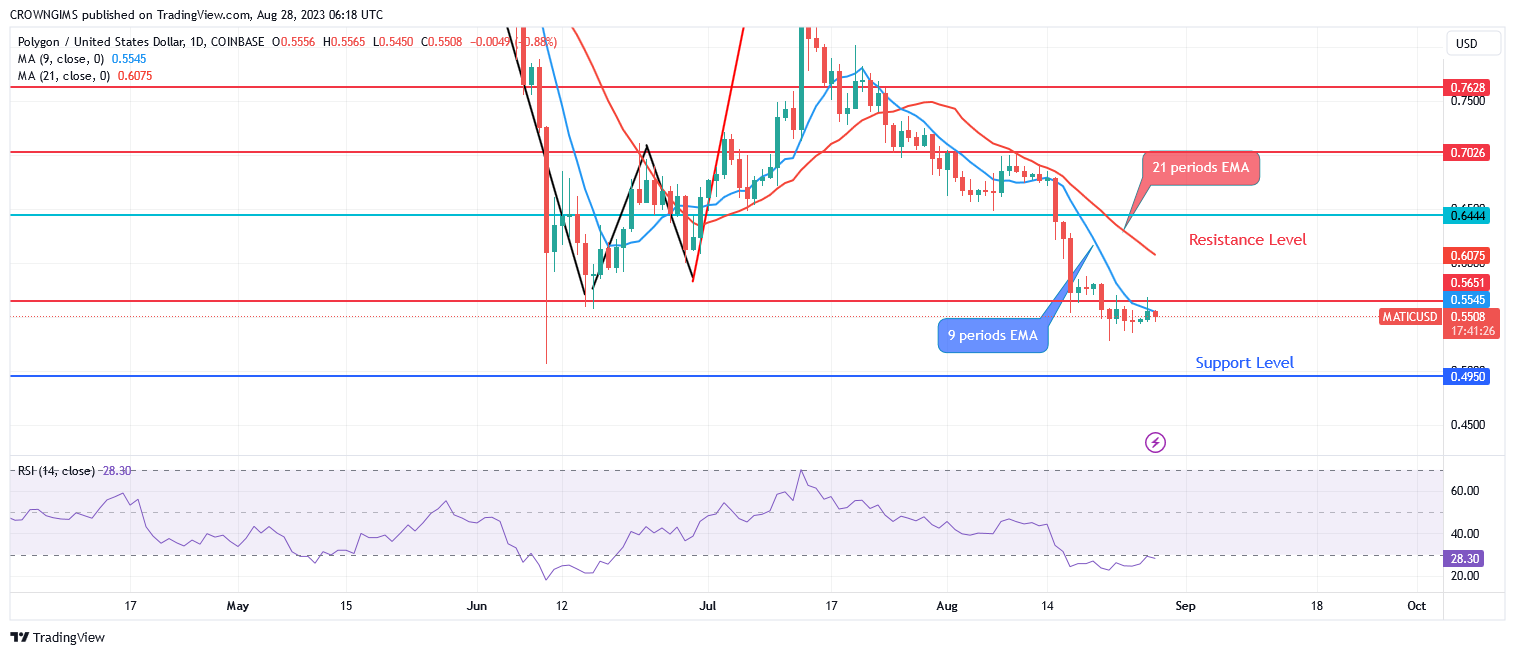
Given that MATIC is trading below both the 9- and 21-period exponential moving averages, selling is advised. Before attempting to cross the $0.64 and $0.70 resistance levels, Polygon must first overcome the $0.56 resistance level. If sellers are successful in uniting their forces, the market may move past the $0.49 support level and be exposed to the $0.33 and $0.25 levels.
MATIC/USD Short-term Trend: Bearish
Polygon is on a bearish movement on a 4-hour time horizon. Bulls took control of the Polygon market over the past three weeks as the double bottom chart pattern developed at the $0.56 support level and the price rose to $0.87. The bearish pressure grew as pressure grew against the $0.87 barrier level. As selling battled the bulls, the price fell and tested the $0.56 mark. At the moment, the price is facing $0.49 level.
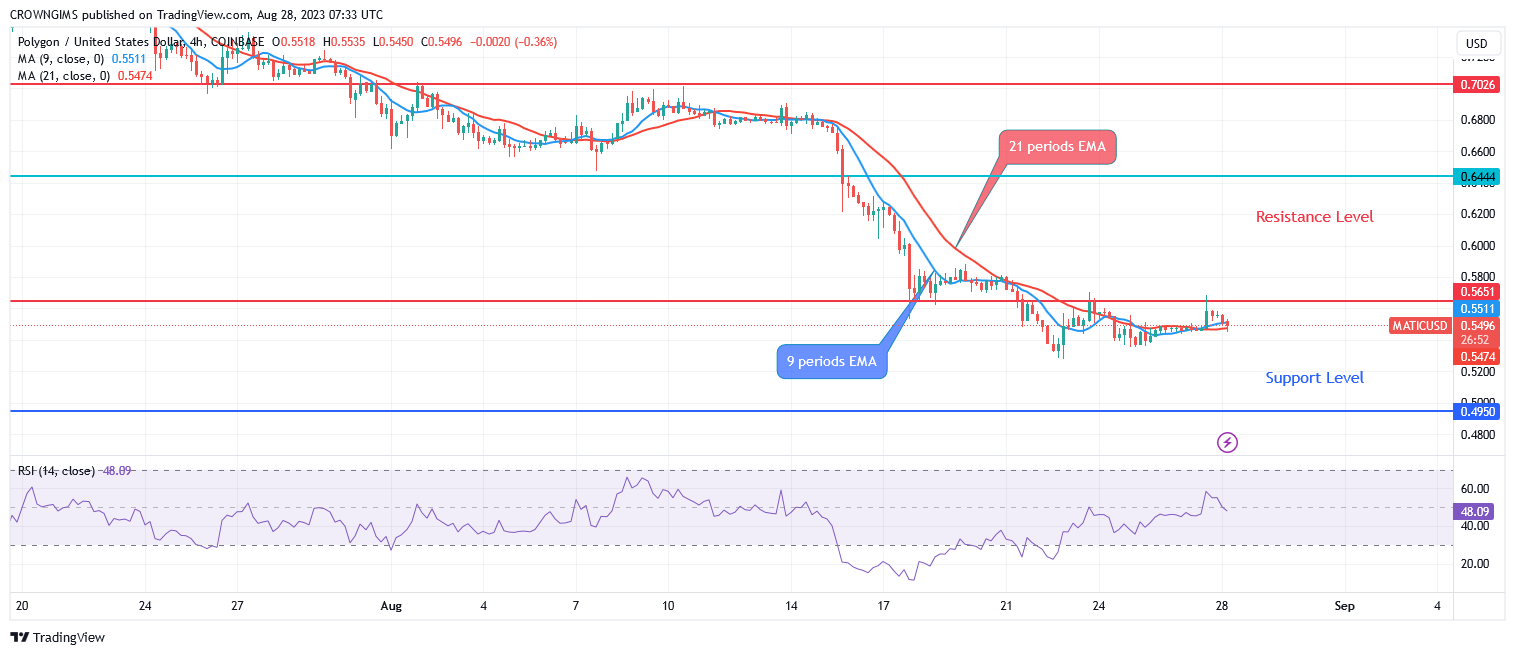
The Polygon price is currently below the two EMAs. The 21-day EMA and the 9-period EMA are not far apart. The period 14 signal line for the relative strength index is pointing up at level 50, indicating a sell.
You can purchase Lucky Block – Guide, Tips & Insights | Learn 2 Trade here. Buy LBLOCK
- Broker
- Min Deposit
- Score
- Visit Broker

- Award-winning Cryptocurrency trading platform
- $100 minimum deposit,
- FCA & Cysec regulated

- 20% welcome bonus of upto $10,000
- Minimum deposit $100
- Verify your account before the bonus is credited
- Fund Moneta Markets account with a minimum of $250
- Opt in using the form to claim your 50% deposit bonus
Learn to Trade
Never Miss A Trade Again

Signal Notification
Real-time signal notifications whenever a signal is opened, closes or Updated

Get Alerts
Immediate alerts to your email and mobile phone.

Entry Price Levels
Entry price level for every signal Just choose one of our Top Brokers in the list above to get all this free.