Bears may take over Polygon Market
Polygon (MATICUSD) Price Analysis – 13 February
Polygon can move past the $1.31 resistance level when the bulls’ momentum picks up, even more, oomph, and be exposed to the $1.40 and $1.49 levels. Polygon may decrease and breach the $1.19 support level, which would drive the price down to the $1.12 and $1.01 support levels if sellers are successful in deterring buyers at the $1.31 resistance level.
Key Levels:
Resistance levels: $1.31, $1.40, $1.49
Support levels: $1.19, $1.12, $1.01
MATIC/USD Long-term Trend: Bullish
MATIC/USD is bullish in the long-term outlook. The ascent of MATICUSD is still being propelled by the triple bottom chart pattern created at the support level of $0.76 on January 2. The buyers still rule the MATIC market. The currency was under buyers’ pressure to move northward. As buyers became more powerful, the price broke through the $1.12 and $1.19 resistance levels. On February 4th, the resistance level of $1.31 was tested. At the moment, Monero – Guide, Tips & Insights | Learn 2 Trade is pulling back to retest the $1.19 level.
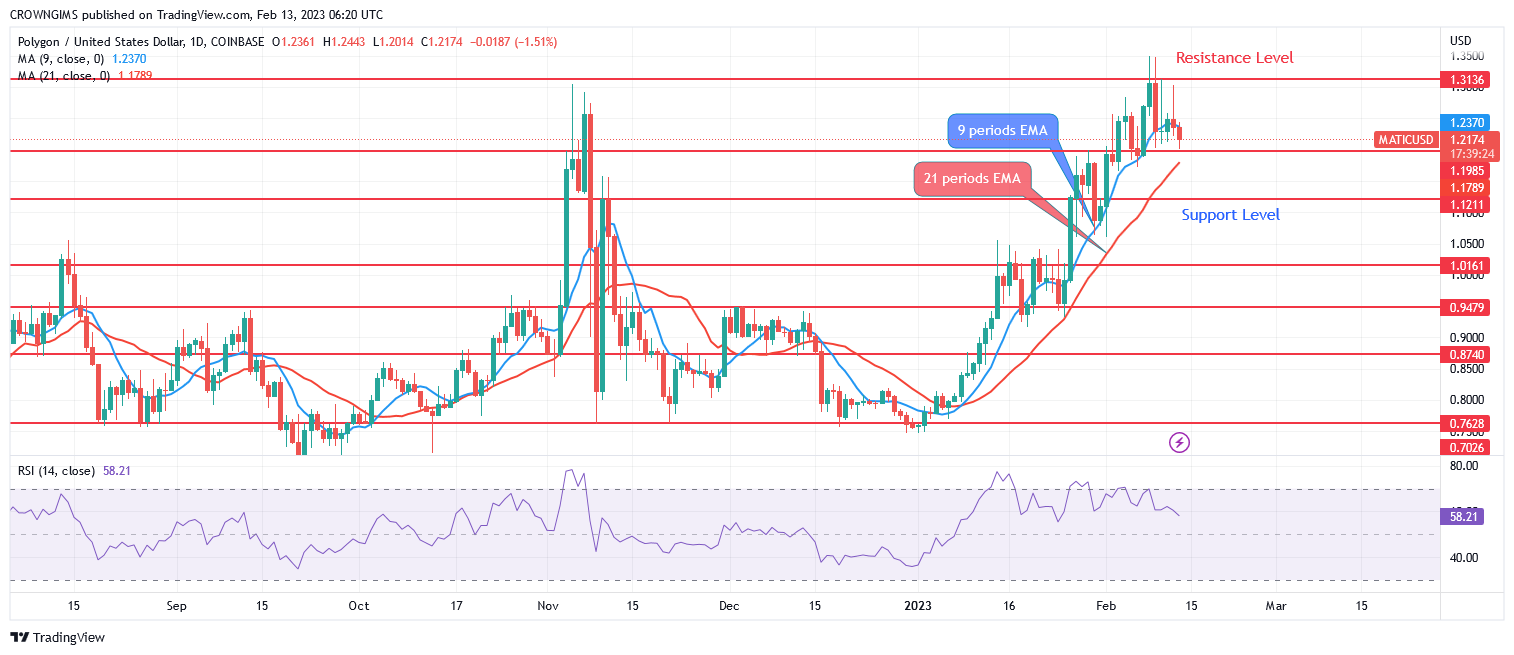
At close range, MATIC continues to trade above both the 9- and 21-period exponential moving averages, confirming the price’s retracement. The upside of the rapid-moving average is greater than the slow-moving average. When the bulls’ momentum picks up, even more, oomph, the price can move past the $1.31 resistance level and be exposed to the $1.40 and $1.49 levels. Polygon may decrease and breach the $1.19 support level, which would drive the price down to the $1.12 and $1.01 support levels if sellers are successful in deterring buyers at the $1.31 resistance level.
MATIC/USD Short-term Trend: Bearish
Polygon is on the bearish movement in 4-hour time-frame. The bulls triumphed over the bears, ending the brief range movement that occurred during the previous three weeks between the $1.01 and $0.94 levels. Last week, the price broke through the $1.31 barrier but the sellers opposed the increase and it is declining to try to break down the $1.19 level.
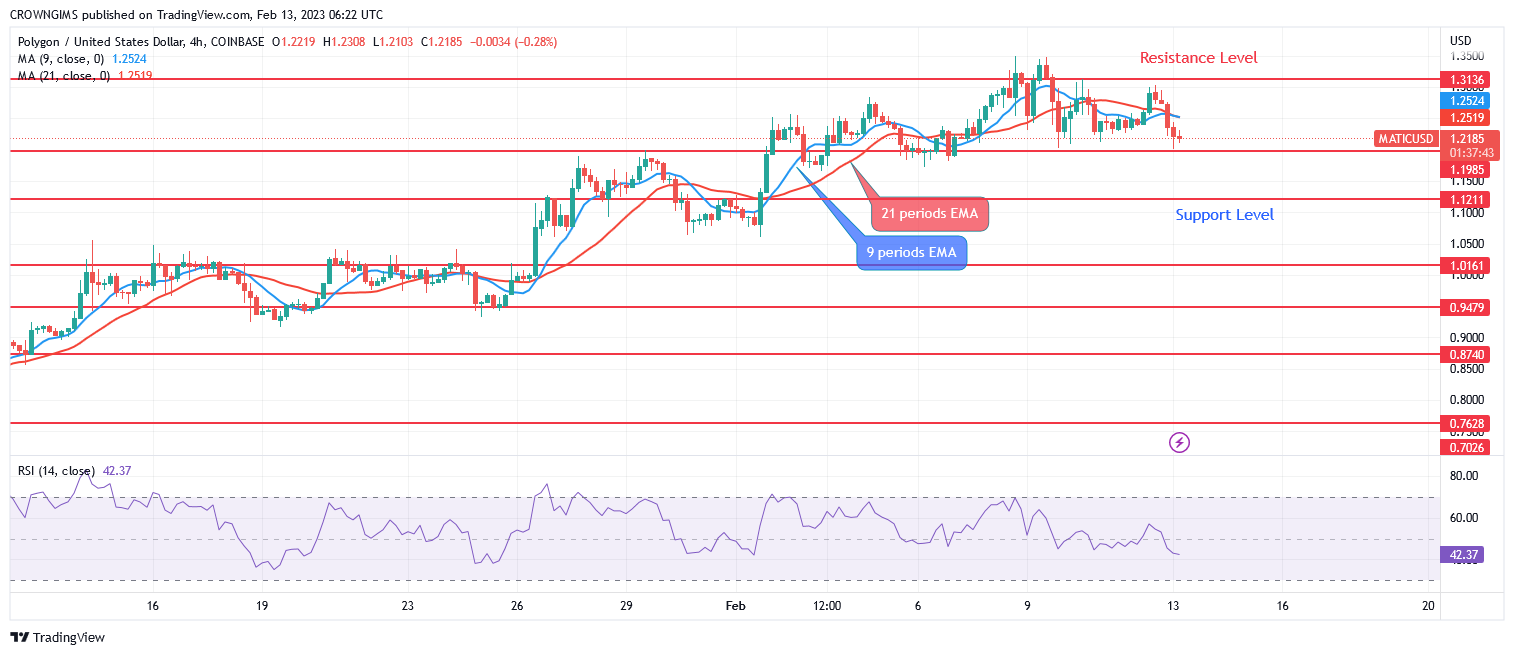
The price appears to be progressively falling as the bullish momentum appears to have run its course. The Polygon price is trading below the two EMAs as a sign of a bearish market. The 9-day EMA is crossing the 21-period EMA downside. The signal line on the relative strength index period 14 shows a bearish direction at 41 levels.
You can purchase Lucky Block – Guide, Tips & Insights | Learn 2 Trade here. Buy LBLOCK
- Broker
- Min Deposit
- Score
- Visit Broker

- Award-winning Cryptocurrency trading platform
- $100 minimum deposit,
- FCA & Cysec regulated

- 20% welcome bonus of upto $10,000
- Minimum deposit $100
- Verify your account before the bonus is credited
- Fund Moneta Markets account with a minimum of $250
- Opt in using the form to claim your 50% deposit bonus
Learn to Trade
Never Miss A Trade Again

Signal Notification
Real-time signal notifications whenever a signal is opened, closes or Updated

Get Alerts
Immediate alerts to your email and mobile phone.

Entry Price Levels
Entry price level for every signal Just choose one of our Top Brokers in the list above to get all this free.