Bears may take over Polygon Market
Polygon (MATICUSD) Price Analysis – 06 February
Polygon can advance past the $1.31 resistance level and be exposed to the $1.40 and $1.49 levels when the bulls’ momentum takes up even more oomph. If sellers are successful in discouraging buyers at the $1.31 resistance level, Polygon may decline and breach the $1.19 support level, which would lower the price to the $1.12 and $1.01 support levels.
Key Levels:
Resistance levels: $1.31, $1.40, $1.49
Support levels: $1.19, $1.12, $1.01
MATIC/USD Long-term Trend: Bullish
MATIC/USD is bullish in the long-term outlook. The triple bottom chart pattern formed at the support level of $0.76 on January 02 is still driven the MATICUSD upside. MATIC market is still dominated by buyers. Buyers’ pressure was sufficient to cause the currency to advance northward. The price passed through the $1.12 and $1.19 resistance levels as buyers gained strength. The resistance level of $1.31 was tested on 04 February. The coin is pulling back at the moment.
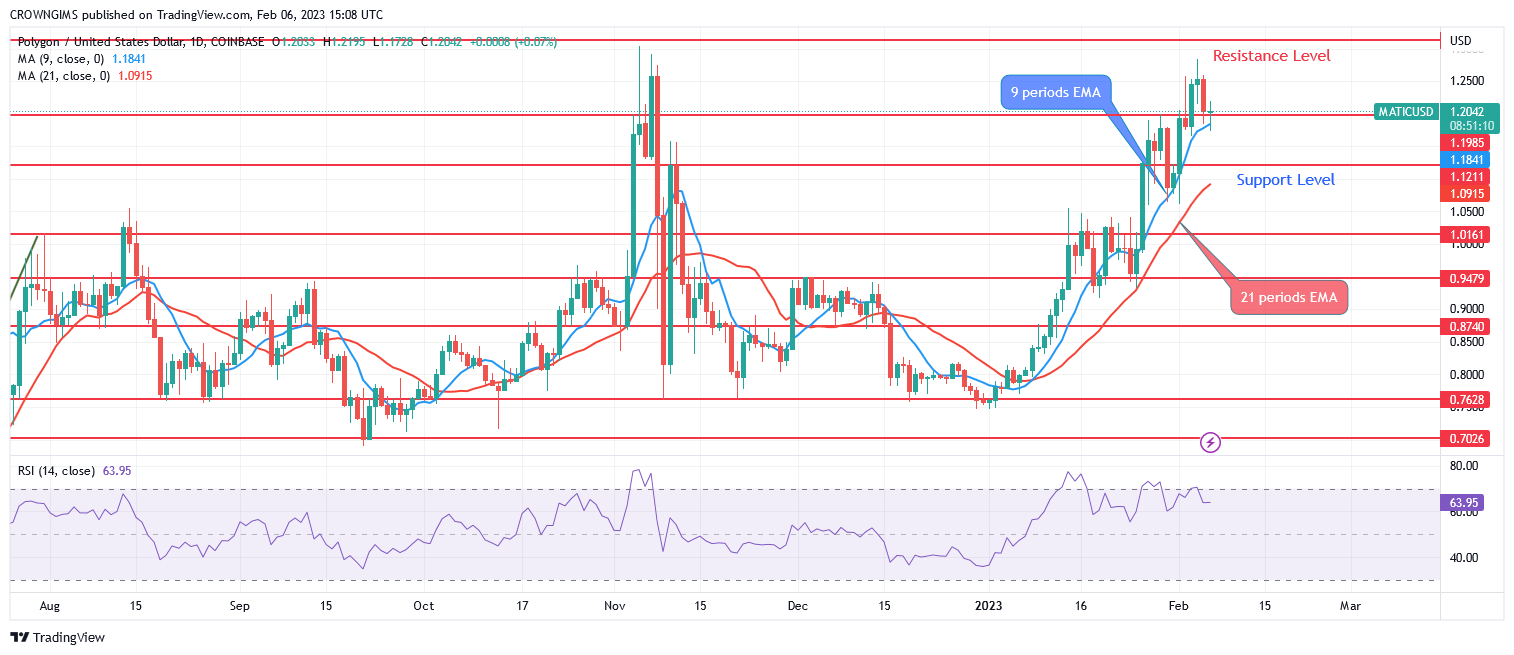
The price rose and tested the $1.31 level. MATIC retains its trading above both the 9- and 21-period exponential moving averages at close range which confirms the pulling back of the price. The fast-moving average’s upside has surpassed the slow-moving average’s. The price can advance past the $1.31 resistance level and be exposed to the $1.40 and $1.49 levels when the bulls’ momentum takes up even more oomph. If sellers successfully discourage buyers at the $1.31 resistance level, Polygon may decline and breach the $1.19 support level, which would lower the price to the $1.12 and $1.01 support levels.
MATIC/USD Short-term Trend: Bearish
Polygon is on the bearish movement in a 4-hour time frame. The brief ranging movement that took place last two weeks within the $1.01 and $0.94 levels was brought to an end when the bulls prevailed over the bears. The price started moving upward and reached the $1.31 barrier level last week. It seems the bullish momentum is exhausted and the price is declining gradually.
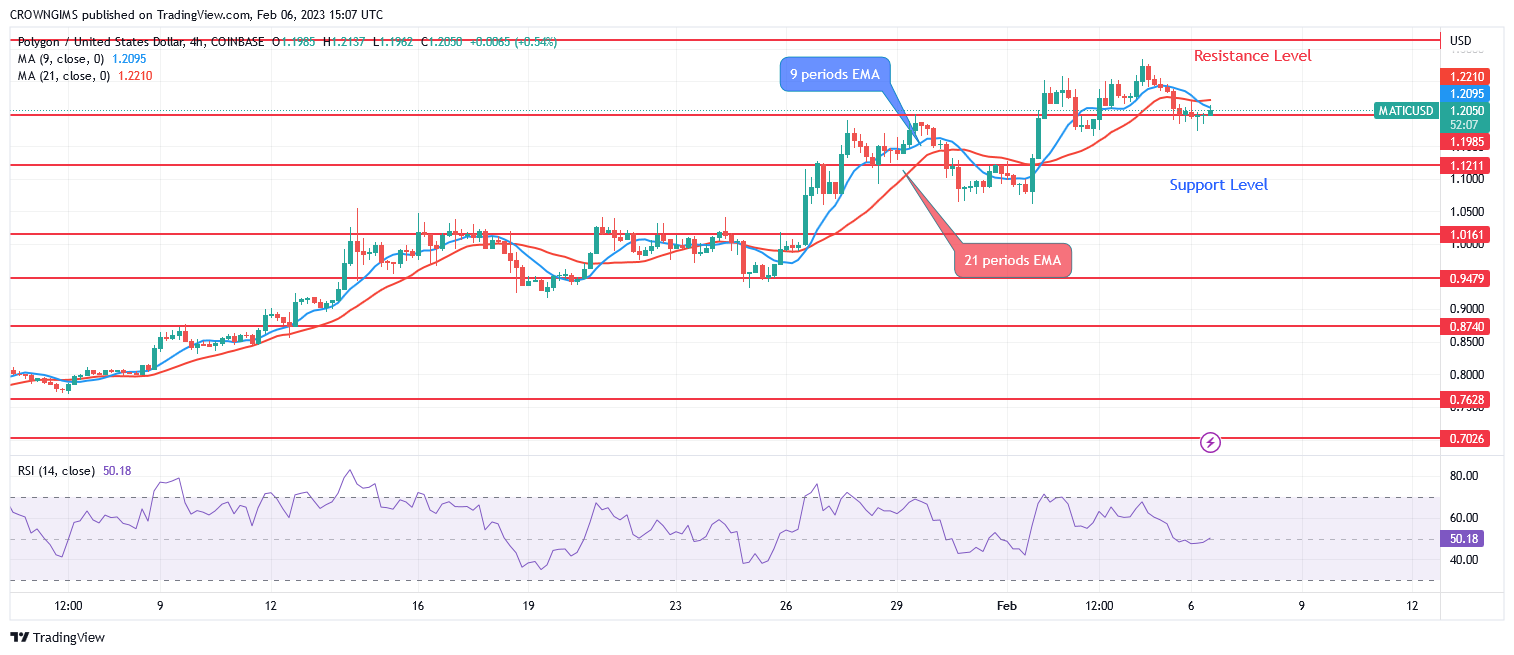
The Polygon price is trading below the two EMAs as a sign of a bearish market. The 9-day EMA is crossing the 21-period EMA downside. The signal line on the relative strength index period 14 shows a bearish direction at 47 levels.
You can purchase Lucky Block – Guide, Tips & Insights | Learn 2 Trade here. Buy LBLOCK
- Broker
- Min Deposit
- Score
- Visit Broker

- Award-winning Cryptocurrency trading platform
- $100 minimum deposit,
- FCA & Cysec regulated

- 20% welcome bonus of upto $10,000
- Minimum deposit $100
- Verify your account before the bonus is credited
- Fund Moneta Markets account with a minimum of $250
- Opt in using the form to claim your 50% deposit bonus
Learn to Trade
Never Miss A Trade Again

Signal Notification
Real-time signal notifications whenever a signal is opened, closes or Updated

Get Alerts
Immediate alerts to your email and mobile phone.

Entry Price Levels
Entry price level for every signal Just choose one of our Top Brokers in the list above to get all this free.