Bearish trend continues in Polygon Market
Polygon (MATICUSD) Price Analysis – 27 March
Polygon may decrease and breach the $1.01 support level, which would drive the price down to the $0.94 and $0.87 support levels. If buyers are successful in gathering more force, the price may move upside past the $1.12 resistance level and be exposed to the $1.20 and $1.31 levels.
Key Levels:
Resistance levels: $1.12, $1.20, $1.31
Support levels: $1.01, $0.94, $0.87
MATIC/USD Long-term Trend: Bearish
MATIC/USD is bearish in the long-term outlook. From the $1.54 barrier high, the price of cryptocurrency started to decline. With the development of further bearish pressure, sellers increase their pressure. On March 10, it breached the previous support levels of $1.42 and $1.31 and found support at $0.94. The price declined to break down the $1.20 and $1.12 resistance levels. It is currently facing a support level of $1.01.
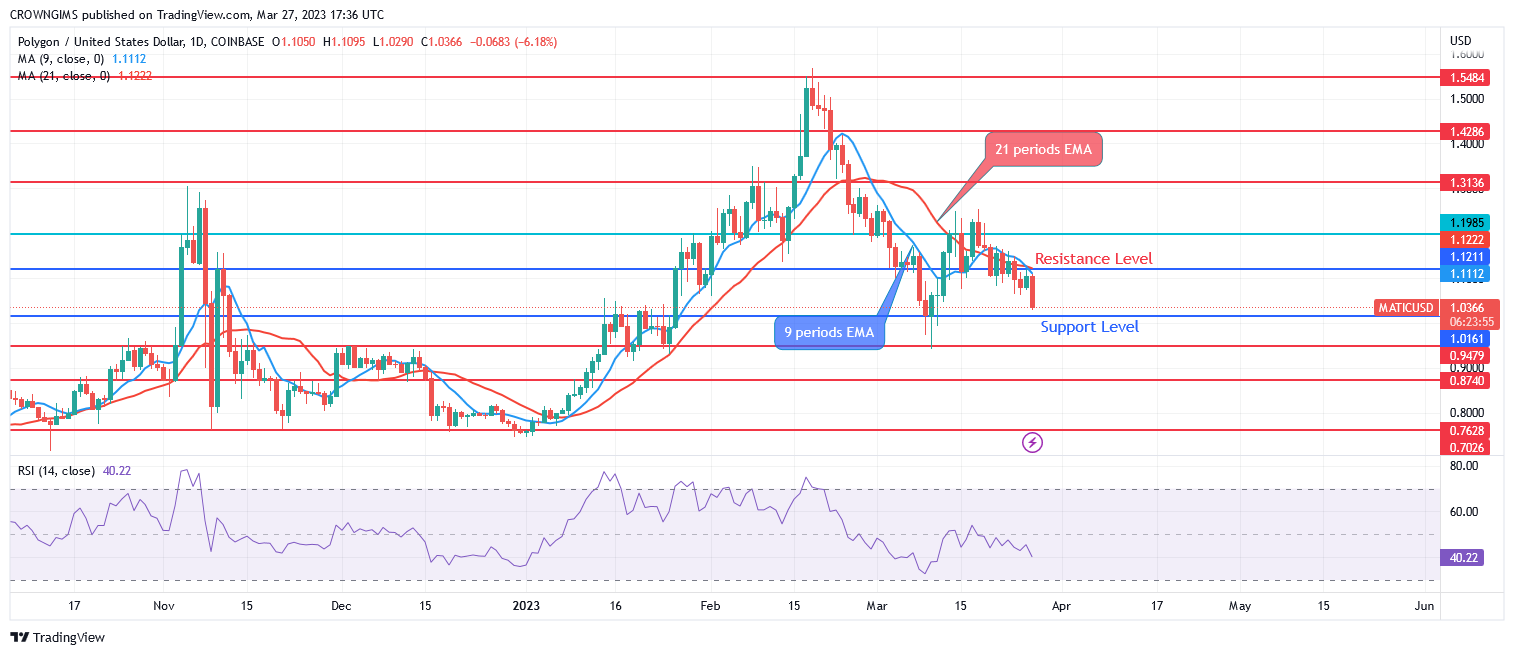
MATIC is currently trading slightly below the 9-period EMA and 21-period EMA as a sign of bearish movement. Polygon may decrease and breach the $1.01 support level, which would drive the price down to the $0.94 and $0.87 support levels. If buyers are successful in gathering more force, the price may move upside past the $1.12 resistance level and be exposed to the $1.20 and $1.31 levels.
MATIC/USD Short-term Trend: Bearish
Polygon is on the bearish movement in a 4-hour time-frame. Last week, bears were in charge of the MATIC market. On 13 March, $1.20 level rejected the price increase as a resistance level. Further bearish pressure declines the price toward the $1.01 barrier level. The price penetrated the just mentioned level targeting $1.01 level. Sellers are saturating the MATIC market.
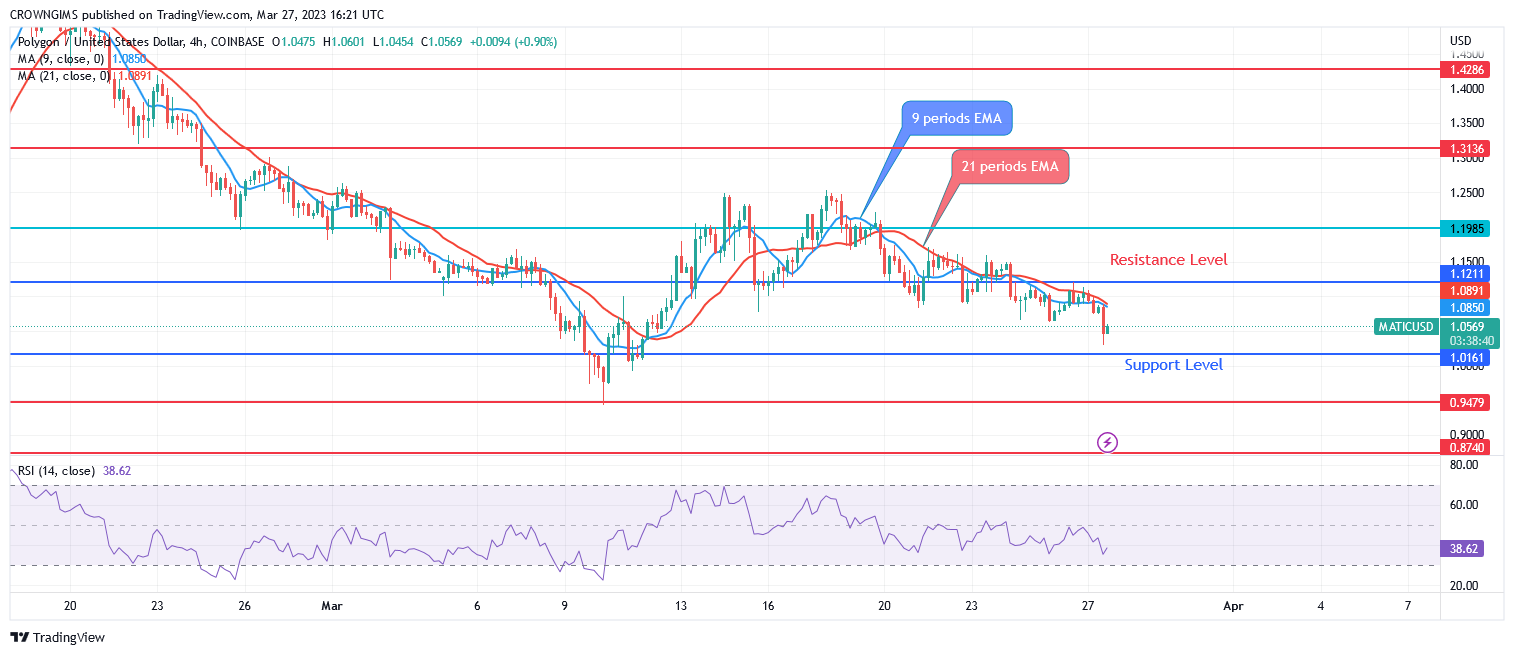
The Polygon price is trading below the two EMAs. The 9-period EMA is below the 21-day EMA. At 33 levels, the relative strength index period 14’s signal line is pointing in a bearish direction.
You can purchase Lucky Block – Guide, Tips & Insights | Learn 2 Trade here. Buy LBLOCK
- Broker
- Min Deposit
- Score
- Visit Broker

- Award-winning Cryptocurrency trading platform
- $100 minimum deposit,
- FCA & Cysec regulated

- 20% welcome bonus of upto $10,000
- Minimum deposit $100
- Verify your account before the bonus is credited
- Fund Moneta Markets account with a minimum of $250
- Opt in using the form to claim your 50% deposit bonus
Learn to Trade
Never Miss A Trade Again

Signal Notification
Real-time signal notifications whenever a signal is opened, closes or Updated

Get Alerts
Immediate alerts to your email and mobile phone.

Entry Price Levels
Entry price level for every signal Just choose one of our Top Brokers in the list above to get all this free.