Buyers’ Momentum Increases
Polygon (MATICUSD) Price Analysis – 13 November
Before attempting to cross the resistance levels of $0.98 and $1.0, Polygon must first overcome the $0.94 barrier. If sellers gain some traction, the market can break through the $0.87 support level and expose itself to the $0.76 and $0.70 levels
Key Levels:
Resistance levels: $0.94, $0.98, $1.0
Support levels: $0.87, $0.76, $0.70
MATIC/USD Long-term Trend: Bullish
For MATIC/USD, the long-term prognosis is favorable. Cryptocurrency found support at $0.49. For about two weeks, it oscillated between $0.49 and $0.59. The negative momentum caused the price to drop to a low of the $0.49 barrier level, following which the negative trend started to reverse. Buyers guarded the $0.49 support level, preventing a further decline. MATIC broke up $0.70, and $0.87 levels. It is currently facing a resistance level of $0.94.
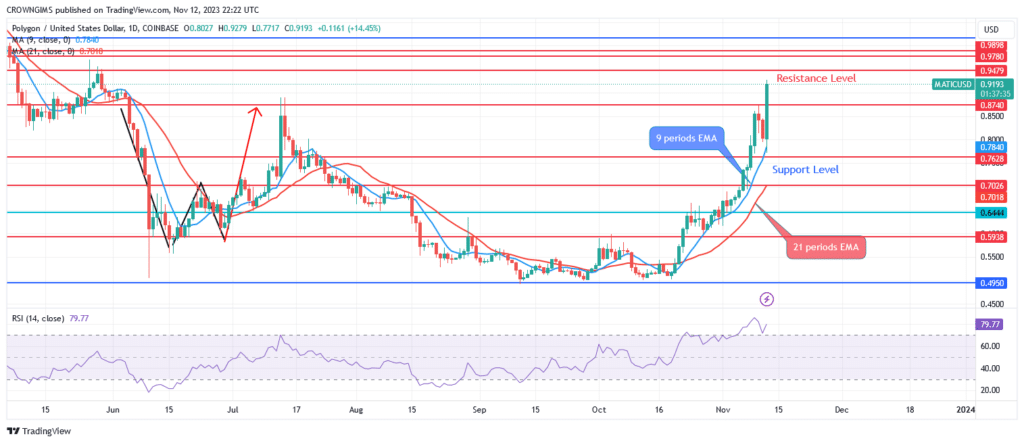
Bulls are in control of the market when 9-EMA periods are above 21-EMA and MATIC trading above exponential moving averages. Before attempting to cross the resistance levels of $0.98 and $1.0, Polygon must first overcome the $0.94 barrier. If sellers gain some traction, the market can break through the $0.87 support level and expose itself to the $0.76 and $0.70 levels.
MATIC/USD Short-term Trend: Bullish
The 4-hour inclination of a polygon is displayed. The price movement on the 4-hour time frame resulted in a double bottom chart pattern at $0.49 from the prior week. It appears that retailers are unable to reduce the price below $0.49. Buyer demand is driving up the price, which is getting close to the $0.94 mark. Due to the previously mentioned level of discord between buyers and sellers, the price is currently inclining.
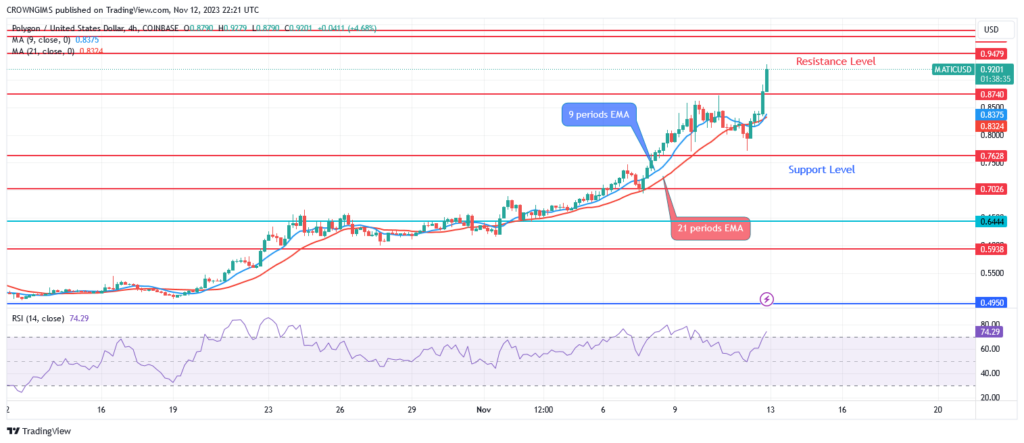
At the moment, Polygon’s price is above both EMAs. The dropping 9-period EMA is crossing the climbing 21-day EMA. The relative strength index’s period 14 signal line is pointing upward at level 73, suggesting a buy.
You can purchase Lucky Block – Guide, Tips & Insights | Learn 2 Trade here. Buy LBLOCK
- Broker
- Min Deposit
- Score
- Visit Broker

- Award-winning Cryptocurrency trading platform
- $100 minimum deposit,
- FCA & Cysec regulated

- 20% welcome bonus of upto $10,000
- Minimum deposit $100
- Verify your account before the bonus is credited
- Fund Moneta Markets account with a minimum of $250
- Opt in using the form to claim your 50% deposit bonus
Learn to Trade
Never Miss A Trade Again

Signal Notification
Real-time signal notifications whenever a signal is opened, closes or Updated

Get Alerts
Immediate alerts to your email and mobile phone.

Entry Price Levels
Entry price level for every signal Just choose one of our Top Brokers in the list above to get all this free.