Polygon (MATICUSD) Price Analysis
Further increase in the Polygon price is highly envisaged provided the resistance level of $0.90 does not hold, $1.01 price level may be reached and penetrated to test the $1.18 level. In case the bears defend the resistance level of $0.90, the price may reverse and continue a bearish trend to $0.74, $0.64 and $0.47 levels.
Key Levels:
Resistance levels: $0.90, $1.01, $1.18
Support levels: $0.74, $0.64, $0.47
MATIC/USD Long-term Trend: Bullish
MATIC/USD price is on the bullish trend on the Long-term outlook. At the completion of the double chart pattern formed on the daily chart. The price pulled back and retested the support level of $0.74 level. The buyers reacted against the pullback with the formation of bullish engulfing candle. More bullish candles were produced and the price increase to break up the $0.90 level. Further price increase envisaged.
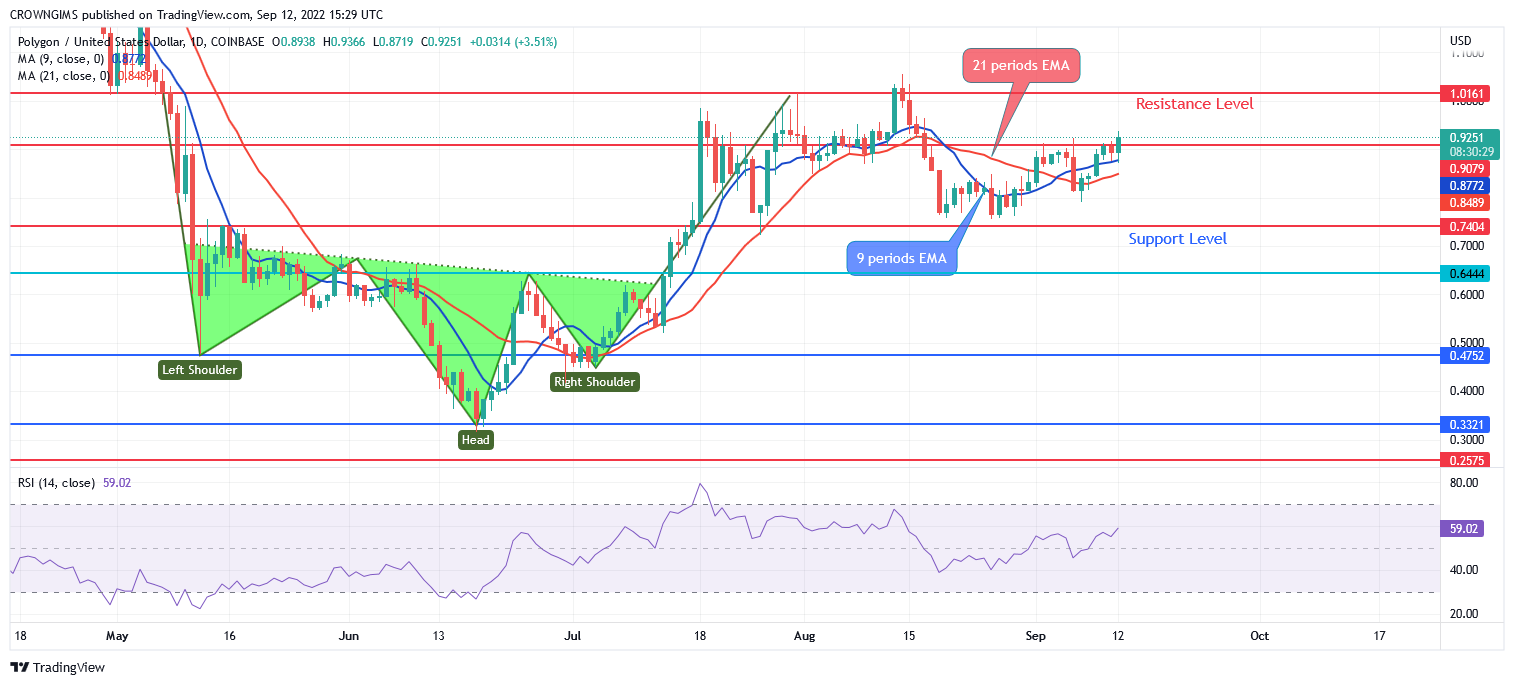
Polygon is trading above the 9 periods EMA and 21 periods EMA. Further increase in the Polygon price is highly envisaged provided the resistance level of $0.90 does not hold, $1.01 price level may be reached and penetrated to test the $1.18 level. In case the bears defend the resistance level of $0.90, the price may reverse and continue a bearish trend to $0.74, $0.64 and $0.47 levels.
MATIC/USD Short-term Trend: Bullsh
Polygon is bullish on the medium-term outlook. The price tested the support level of $0.74 on August 19. The just mentioned level holds the price and that resulted to ranging movement within the $0.90 and $0.74 levels. Today, buyers are gaining more pressure and the price is increasing, aiming to break up the resistance level of $0.90 price.
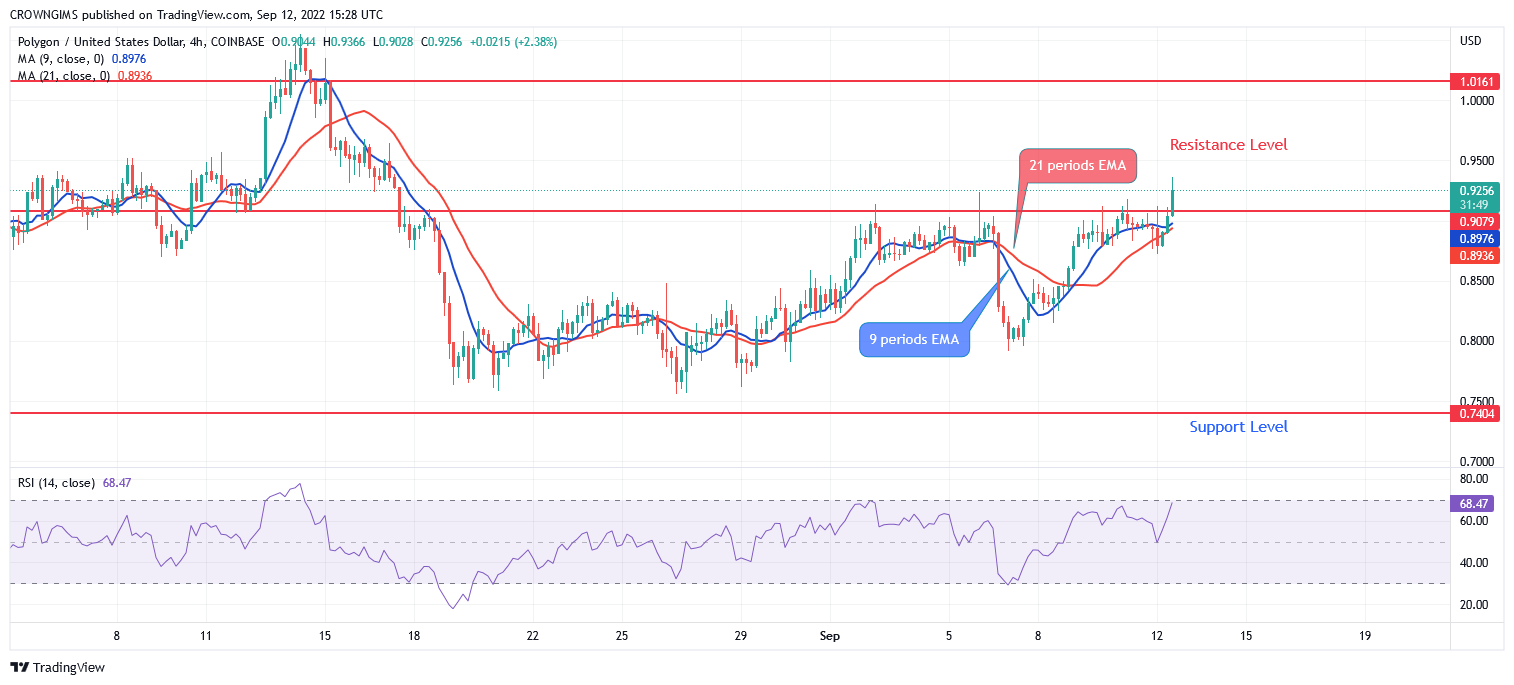
The 9-day EMA is trying to cross the 21-day EMA upside, the Polygon price is trading slightly above the two EMAs which indicates a bullish movement. The relative strength index period 14 is at 66 levels with the signal line pointing up to connote buy signal.
You can purchase Lucky Block – Guide, Tips & Insights | Learn 2 Trade here. Buy LBLOCK
- Broker
- Min Deposit
- Score
- Visit Broker

- Award-winning Cryptocurrency trading platform
- $100 minimum deposit,
- FCA & Cysec regulated

- 20% welcome bonus of upto $10,000
- Minimum deposit $100
- Verify your account before the bonus is credited
- Fund Moneta Markets account with a minimum of $250
- Opt in using the form to claim your 50% deposit bonus
Learn to Trade
Never Miss A Trade Again

Signal Notification
Real-time signal notifications whenever a signal is opened, closes or Updated

Get Alerts
Immediate alerts to your email and mobile phone.

Entry Price Levels
Entry price level for every signal Just choose one of our Top Brokers in the list above to get all this free.