EURUSD Price Analysis – September 12
When the bulls’ momentum break up the resistance level of $1.01, the price may reach resistance levels of $1.02 and $1.03. In case the sellers push down the price below the support level of $1.00, the price may decrease to test the support level of $0.90 which may extend to $0.89 level.
EUR/USD Market
Key Levels:
Resistance levels: $1.01, $1.02, $1.03
Support levels: $1.00, $0.90, $0.89
EURUSD Long-term Trend: Bullish
EURUSD is bullish on the long term outlook. Sellers were in control of the market for more than two weeks. The former support levels of $1.01 and $1.02 have been penetrated downside. Last week, the currency pair eventually found support at $0.98 level. The just mentioned level withstand the sellers’ pressure. Buyers’ increased momentum is noticed with the formation of bullish engulfing candle. The price increase and it is currently struggling to break up $1.01 level.
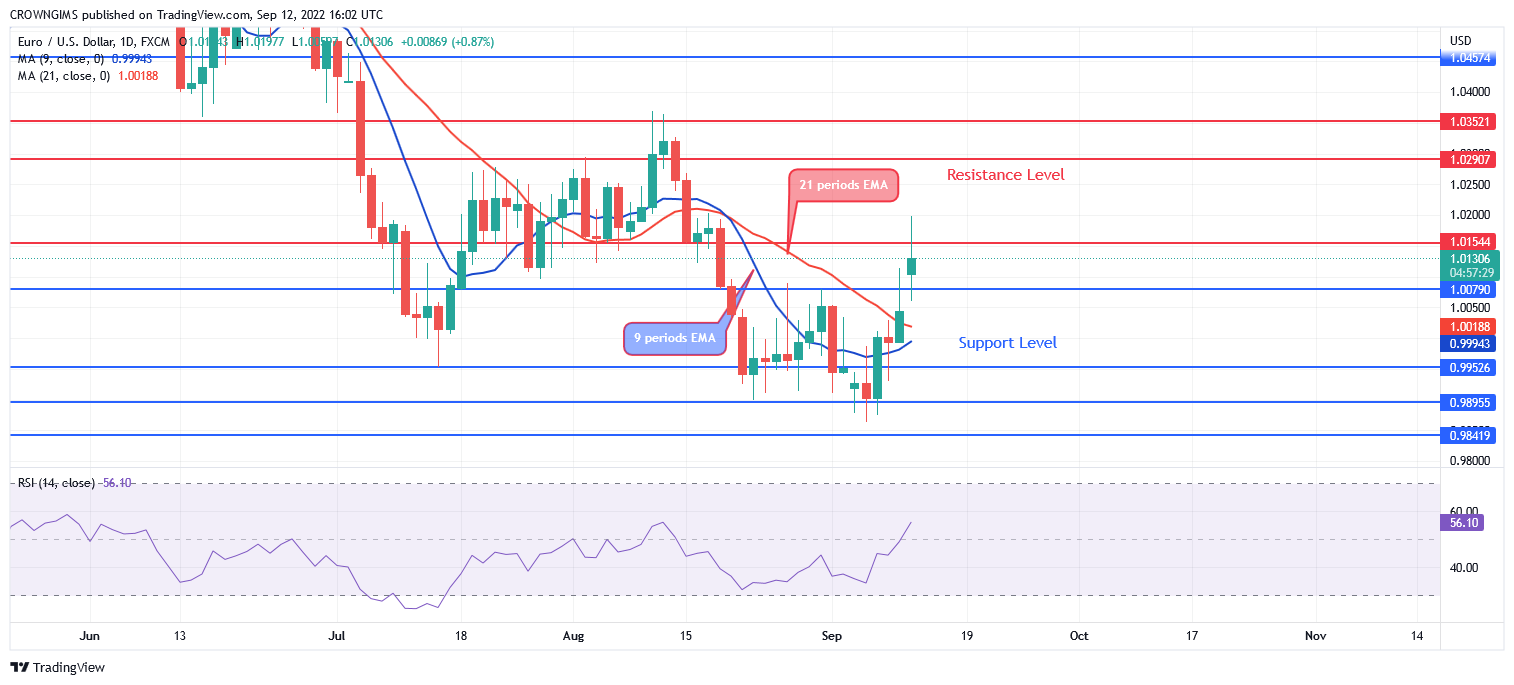
The bulls’ pressure has penetrated the two EMA upside. EURUSD is trading above the 9 periods EMA and the 21 periods EMA. When the bulls’ momentum break up the resistance level of $1.01, the price may reach resistance levels of $1.02 and $1.03. In case the sellers push down the price below the support level of $1.00, the price may decrease to test the support level of $0.90 which may extend to $0.89 level. The Relative Strength Index period 14 is at 56 levels with the signal line pointing up to indicate a buy signal.
EURUSD medium-term Trend: Bullish
EURUSD is bullish in the medium-term outlook. The support level of $0.99 was tested last week with much pressure from the sellers. The bears’ pressure became weak and could not break down the just mentioned support level. Bullish engulfing candle formed and the price broke up the dynamic resistance levels.
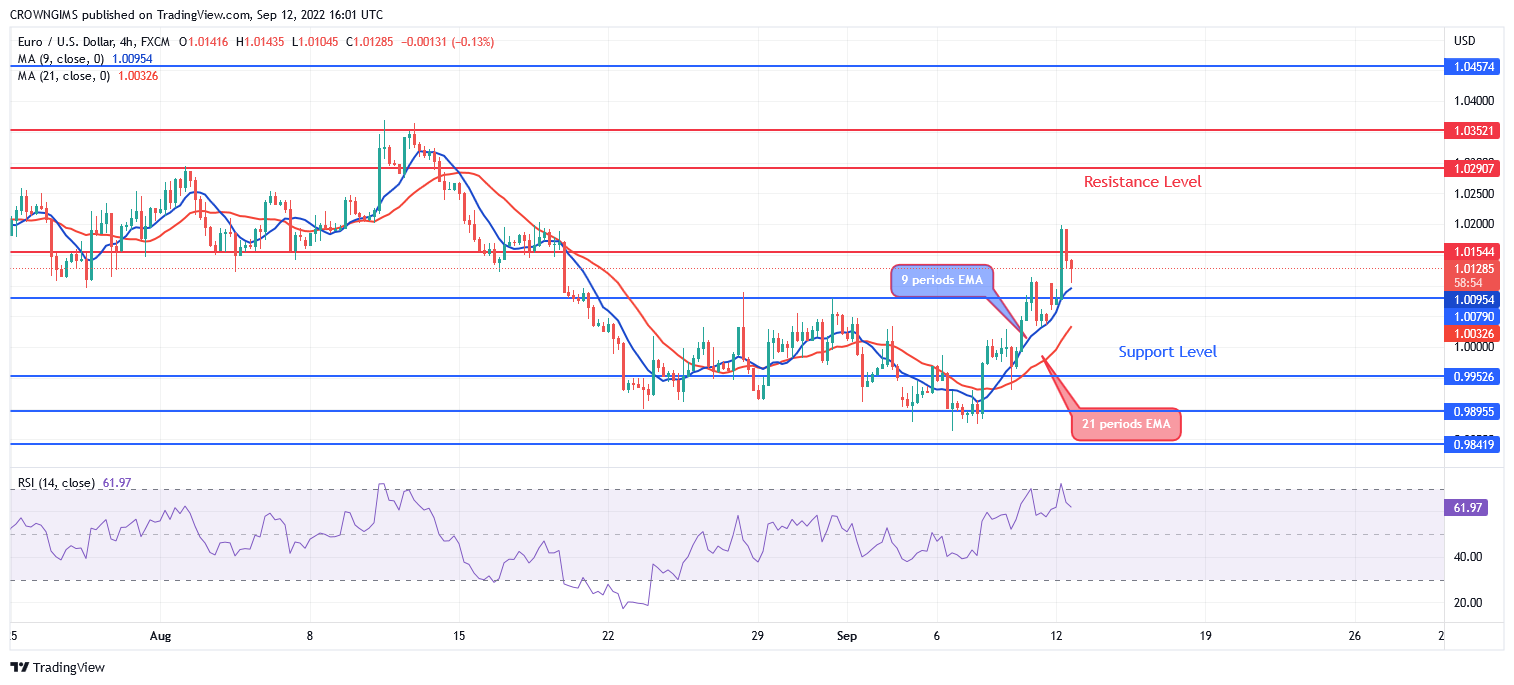
The price is trading above the 9 periods EMA and 21 periods EMA, the two EMAs are separated from each other as a sign of strong bullish momentum in the market. Relative Strength Index period 14 is pointing down at 65 levels indicating sell signal which may be a pullback.
You can purchase Lucky Block – Guide, Tips & Insights | Learn 2 Trade here. Buy LBLOCK
- Broker
- Min Deposit
- Score
- Visit Broker

- Award-winning Cryptocurrency trading platform
- $100 minimum deposit,
- FCA & Cysec regulated

- 20% welcome bonus of upto $10,000
- Minimum deposit $100
- Verify your account before the bonus is credited
- Fund Moneta Markets account with a minimum of $250
- Opt in using the form to claim your 50% deposit bonus
Learn to Trade
Never Miss A Trade Again

Signal Notification
Real-time signal notifications whenever a signal is opened, closes or Updated

Get Alerts
Immediate alerts to your email and mobile phone.

Entry Price Levels
Entry price level for every signal Just choose one of our Top Brokers in the list above to get all this free.