
Polkadot (DOT) Price Long-term Trend: Ranging
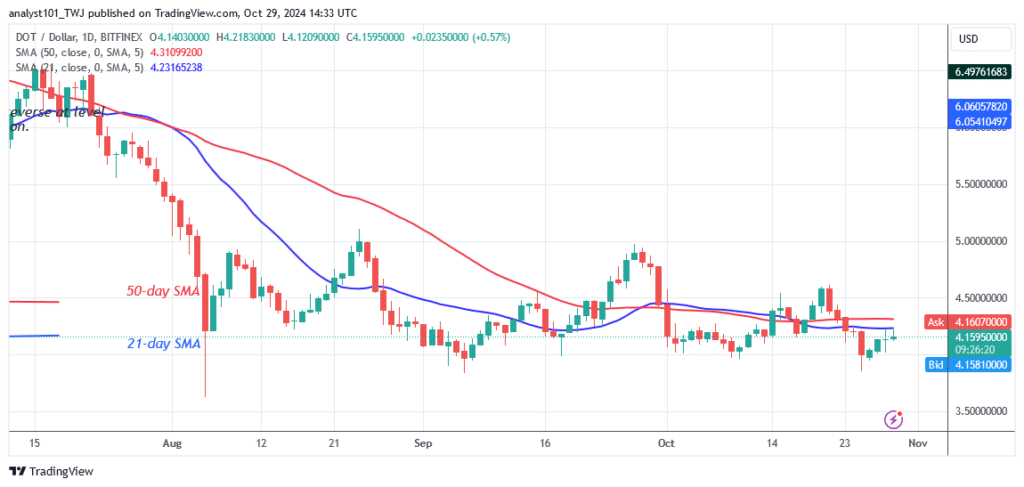
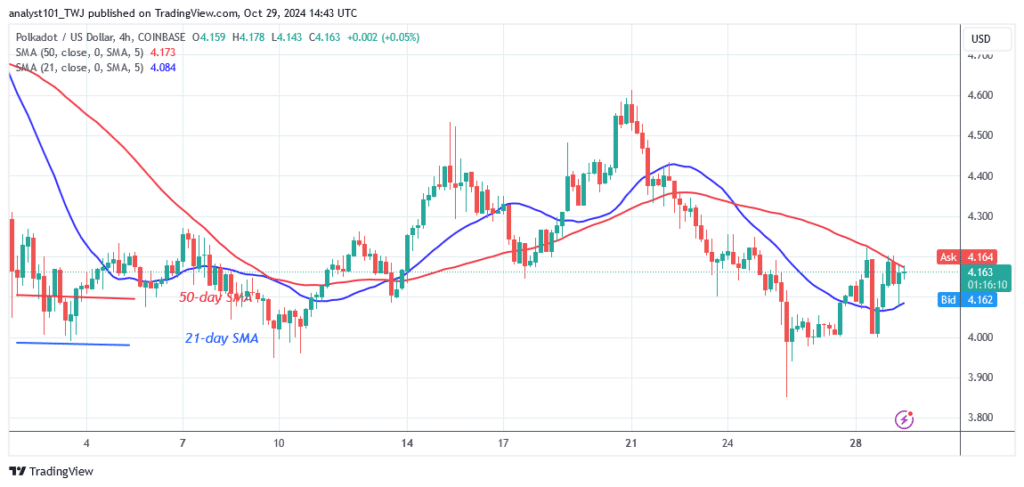
Polkadot’s (DOT) price trades at the bottom of the chart as it trades above the $4.00 low. The altcoin has entered the oversold territory of the market. The bearish trend has ended as it recovers above the current support level of $4.00. Following the price drop on October 25, DOT price reached a low of $3.85 before pulling back.
Technical indicators:
Key Resistance Levels: $10, $12, $14
Key Support Levels: $5, $3, $1
Polkadot Indicator Analysis
Since October 25, the price bars have fallen below the moving averages. Nonetheless, additional declines in the coin are unlikely. The DOT price continues to trade modestly due to the dominance of Doji candlesticks. Moving average lines impede the upward movement.
General Outlook for Polkadot (DOT)
Polkadot price is correcting upward as they trade above the $4.00 low. However, the 50-day SMA has rejected the rising movement. The DOT price trades above the 21-day SMA support but below the 50-day SMA resistance. The altcoin will start to trend once these levels are breached. The cryptocurrency signal remains range-bound as it trades in the bearish trend zone.
Make money without lifting your fingers: Start using a world-class auto trading solution.
.
Note: Learn2.Trade is not a financial advisor. Do your research before investing your funds in any financial asset or presented product or event. We are not responsible for your investment.
.


