Key Resistance Levels: $10, $12,$14
Key Support Levels: $5, $3,$1
Polkadot (DOT) Price Long-term Trend: Bearish
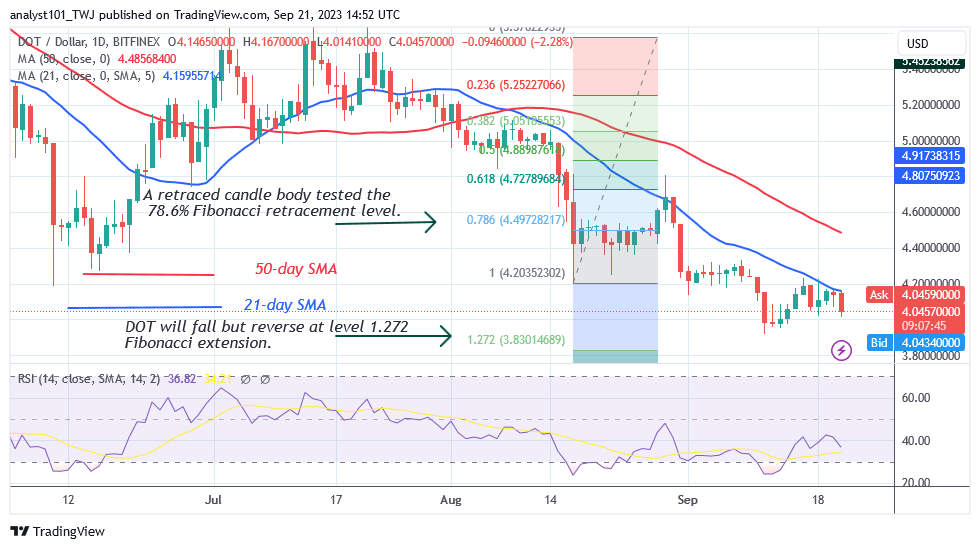
Polkadot (DOT) price has plummeted to the bottom of the chart after hitting a $3.91 low . The crypto asset crashed to a low of $3.91 to build up a new range. The price of the altcoin has ranged from $3.91 to $4.20 since September 11th.
After being rejected at the highest point, the DOT price fell to a low of $4.04. DOT/USD is heavily oversold following a price drop to a low of $3.91. Meanwhile, after a price collapse on August 17, the DOT price corrected upward and a candle body tested the 78.6% Fibonacci retracement level.
Polkadot is expected to fall but then reverse at the 1.272 Fibonacci Extension, or $3.83. The altcoin has currently corrected upward after reaching a low of $3.91.
Daily Chart Indicators Reading:
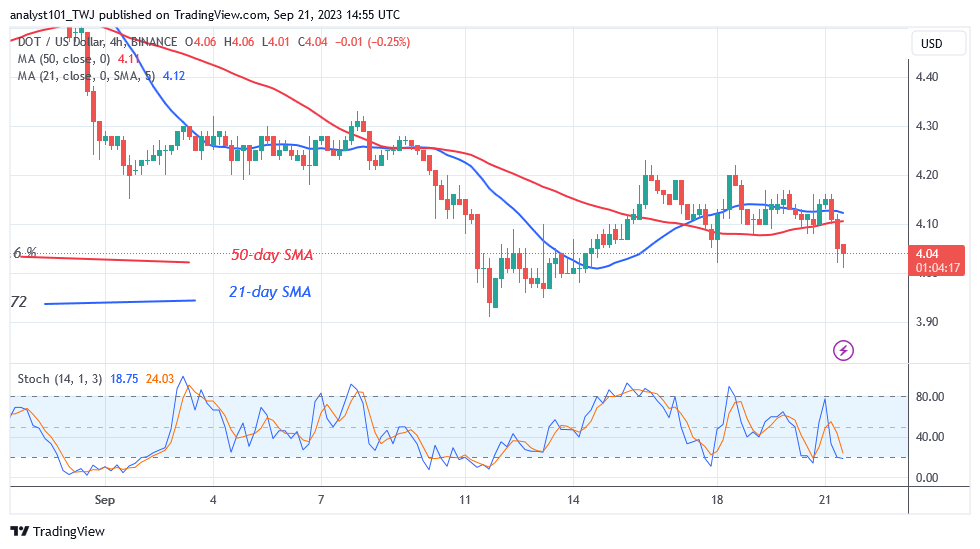
Polkadot is correcting upward as it approaches the Relative Strength Index level 36 for period 14. The altcoin has already entered the market’s oversold zone. It is currently in a bearish trend below the daily Stochastic threshold of 25.
General Outlook for Polkadot (DOT)
The crypto asset is in a new price range between $3.91 and $4.20 after hitting a $3.91 low . Despite retreating, the altcoin is still above the $4.00 support level. The downward trend has reached its peak. The $4.00 support level may be breached by the cryptocurrency.
You can purchase crypto coins here. Buy LBLOCK
Note: Learn2.Trade is not a financial advisor. Do your research before investing your funds in any financial asset or presented product or event. We are not responsible for your investing
- Broker
- Min Deposit
- Score
- Visit Broker

- Award-winning Cryptocurrency trading platform
- $100 minimum deposit,
- FCA & Cysec regulated

- 20% welcome bonus of upto $10,000
- Minimum deposit $100
- Verify your account before the bonus is credited
- Fund Moneta Markets account with a minimum of $250
- Opt in using the form to claim your 50% deposit bonus
Learn to Trade
Never Miss A Trade Again

Signal Notification
Real-time signal notifications whenever a signal is opened, closes or Updated

Get Alerts
Immediate alerts to your email and mobile phone.

Entry Price Levels
Entry price level for every signal Just choose one of our Top Brokers in the list above to get all this free.