Resistance Levels: $60, $62, $64
Key Support Levels: $40, $38,$36
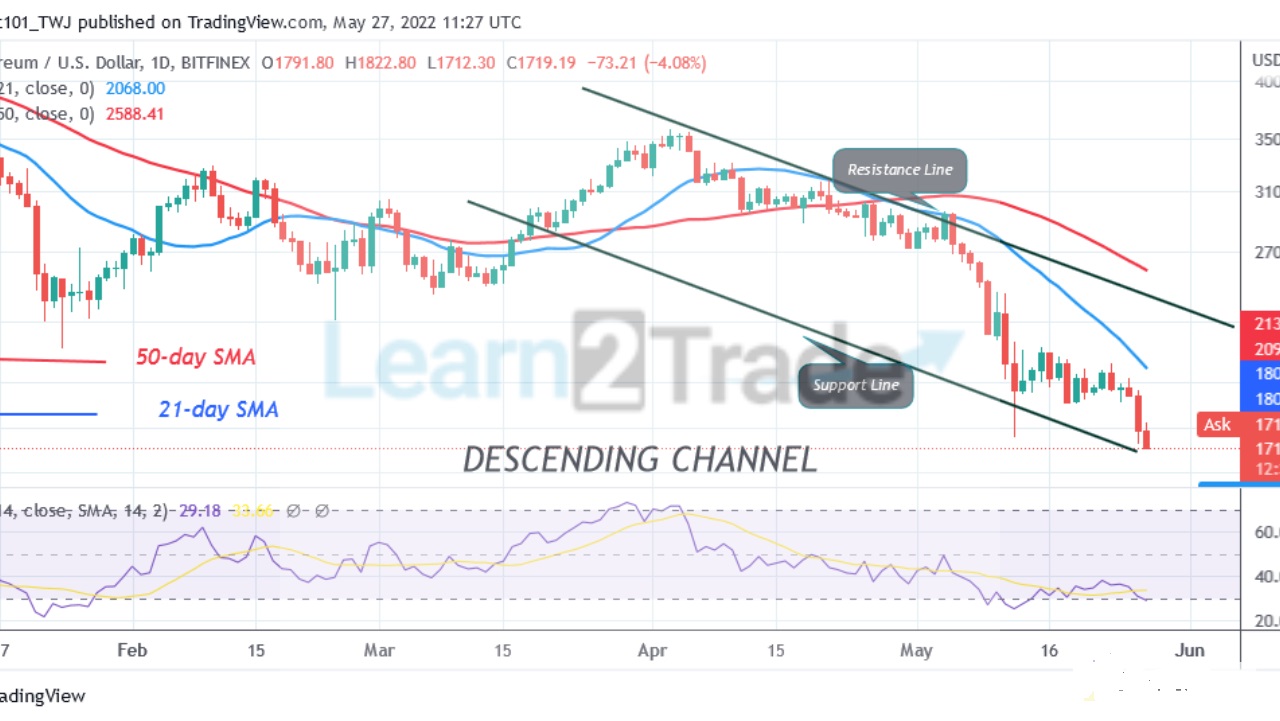
Polkadot (DOT) Price Long-term Trend: Bearish
Polkadot’s (DOT) price is falling as bears attempt to revisit $7.18 Low. In previous price action, Polkadot was fluctuating between $8 and $12 price levels. Today, the upward moves have been restricted below the $10 high. or the 21-day line moving averages. On May 27, the uptrend was repelled by the 21-day line moving average. Further upward movement of the coin is doubtful as the altcoin retraces to $9 support. On the downside, the selling pressure will resume if the bears break below the $8.00 support, The altcoin will revisit the previous low at $7.18. On the other hand, if the $8 support holds and the altcoin rebounds, the market will rally above the moving verges. The bullish momentum will extend to the high of $16.
Daily Chart Indicators Reading:
DOT price is at level 35 of the Relative Strength Index for period 14. The 21-day line SMA and the 50-day line SMA are sloping southward indicating the downtrend. The 21-day line moving average is acting as resistance to price bars.
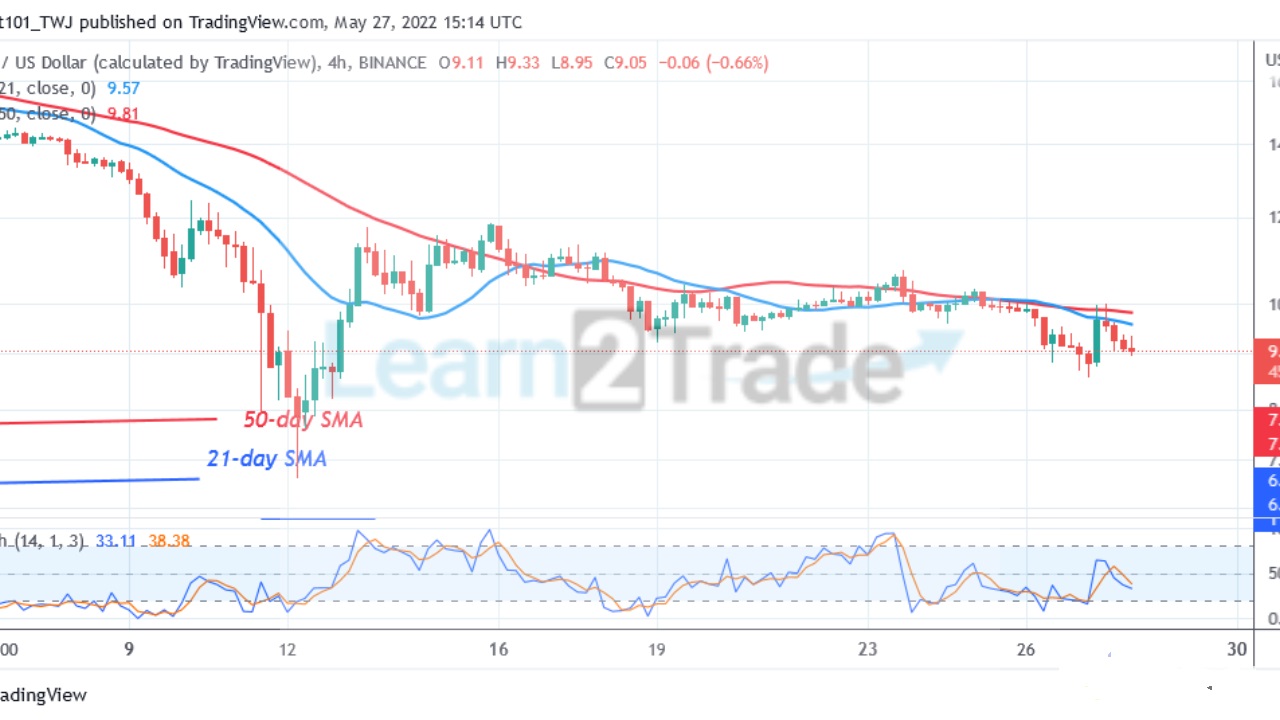
Polkadot (DOT) Medium-term Trend: Ranging
On the 4-hour chart, DOT price is in a sideways trend.
It is falling to the previous low. The price movement has been insignificant because of the presence of small body indecisive candlesticks. DOT price will revisit the previous low at $7.18.
4-hour chart Chart Indicators Reading
The 21-day line SMA and 50-day line SMA are sloping horizontally indicating a sideways move. Polkadot is below the 40% range of the daily stochastic. The market is in a bearish momentum.
General Outlook for Polkadot (DOT)
DOT/USD is likely to resume selling pressure as bears attempt to revisit $7.18 Low. The coin will further decline to the previous low at $7.18.
You can purchase crypto coins here. Buy LBlock
Note: Learn2.Trade is not a financial advisor. Do your research before investing your funds in any financial asset or presented product or event. We are not responsible for your investing
- Broker
- Min Deposit
- Score
- Visit Broker

- Award-winning Cryptocurrency trading platform
- $100 minimum deposit,
- FCA & Cysec regulated

- 20% welcome bonus of upto $10,000
- Minimum deposit $100
- Verify your account before the bonus is credited
- Fund Moneta Markets account with a minimum of $250
- Opt in using the form to claim your 50% deposit bonus
Learn to Trade
Never Miss A Trade Again

Signal Notification
Real-time signal notifications whenever a signal is opened, closes or Updated

Get Alerts
Immediate alerts to your email and mobile phone.

Entry Price Levels
Entry price level for every signal Just choose one of our Top Brokers in the list above to get all this free.