Resistance Levels: $60, $62, $64
Key Support Levels: $40, $38,$36
Polkadot (DOT) Price Long-term Trend: Bearish
Polkadot’s (DOT) price is in a downtrend as bulls defend $7.18 support. On May 12, DOT/USD plunged to the low of $7.18. The selling pressure eased as the altcoin corrected upward to the high of $12. The bulls could not penetrate the recent high, hence the necessity to resume a sideways move. For the past week, the market has been fluctuating between $7.18 and $12 price levels. On the upside, if the bulls break the $12 resistance, the market will rally to $16. On the downside, the coin is likely to hold because of the presence of a candlestick with a long tail. The long tail indicates that the current support has strong buying pressure. Polkadot is likely to hold above the $7.18 support.
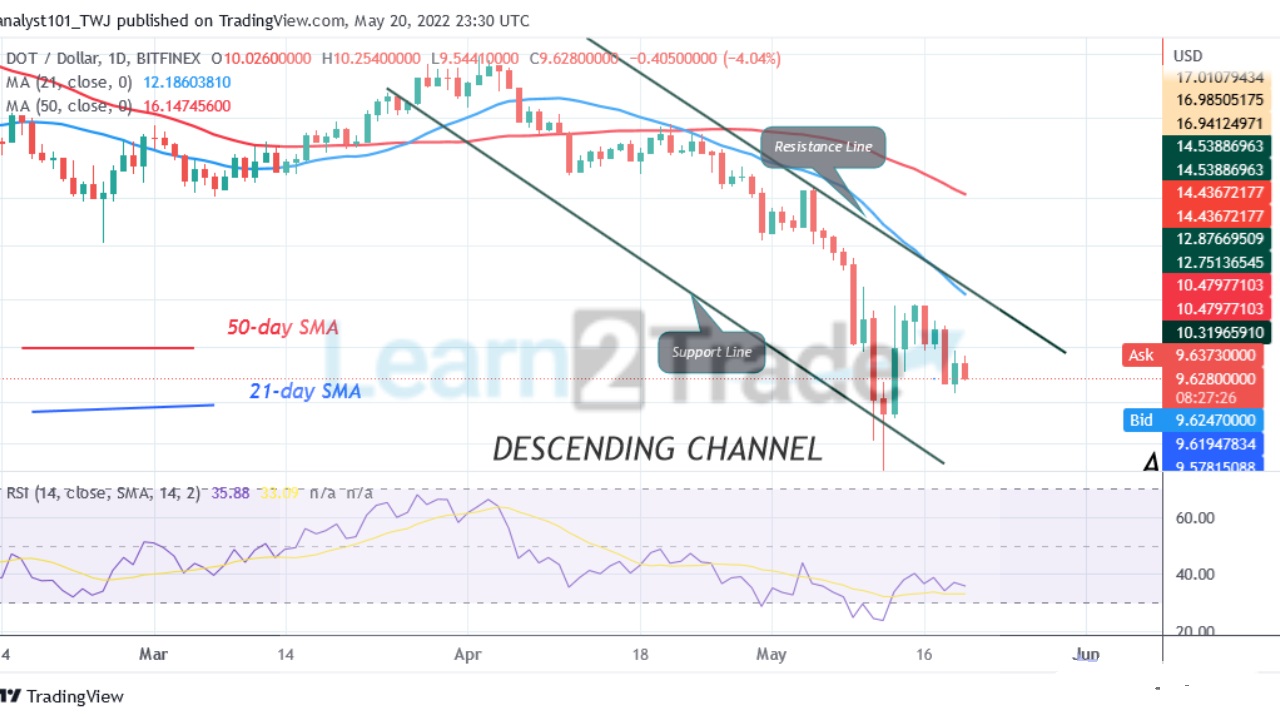
Daily Chart Indicators Reading:
DOT price is at level 37 of the Relative Strength Index for period 14. The market is still in the bearish trend zone despite the upward correction. The 21-day line SMA and the 50-day line SMA are sloping southward indicating the downtrend.
Polkadot (DOT) Medium-term Trend: Ranging
On the 4-hour chart, DOT/USD is in a sideways trend. The coin is fluctuating below the $12 resistance level. The price movement has been insignificant because of the presence of small body indecisive candlesticks. DOT price will fall as it is below the moving averages.
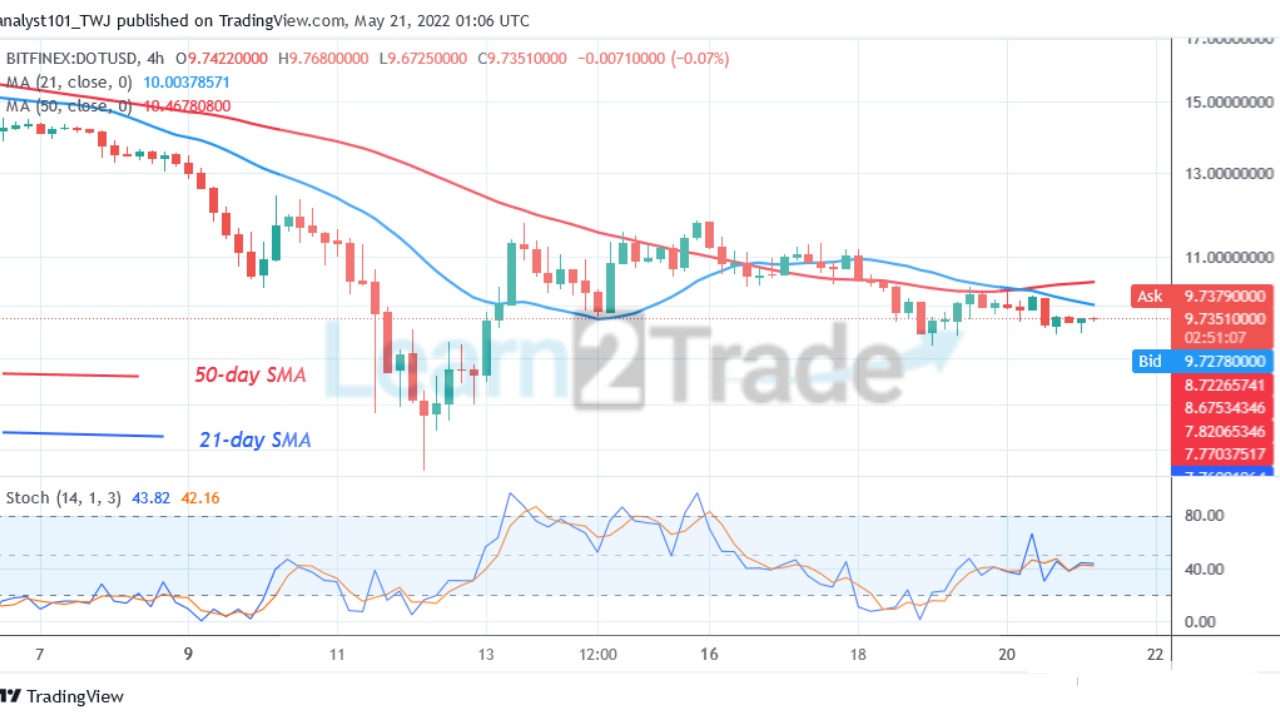
4-hour chart Chart Indicators Reading
The 21-day line SMA and 50-day line SMA are sloping horizontally indicating a sideways move. Polkadot is below the 40% range of the daily stochastic. The market is in a bearish momentum.
General Outlook for Polkadot (DOT)
DOT/USD is still in the bearish trend zone as bulls defend $7.18 support. The coin will further decline if it loses the $7.18 support.
You can purchase crypto coins here. Buy LBlock
Note: Learn2.Trade is not a financial advisor. Do your research before investing your funds in any financial asset or presented product or event. We are not responsible for your investing
- Broker
- Min Deposit
- Score
- Visit Broker

- Award-winning Cryptocurrency trading platform
- $100 minimum deposit,
- FCA & Cysec regulated

- 20% welcome bonus of upto $10,000
- Minimum deposit $100
- Verify your account before the bonus is credited
- Fund Moneta Markets account with a minimum of $250
- Opt in using the form to claim your 50% deposit bonus
Learn to Trade
Never Miss A Trade Again

Signal Notification
Real-time signal notifications whenever a signal is opened, closes or Updated

Get Alerts
Immediate alerts to your email and mobile phone.

Entry Price Levels
Entry price level for every signal Just choose one of our Top Brokers in the list above to get all this free.