Resistance Levels: $60, $62, $64
Key Support Levels: $40, $38,$36
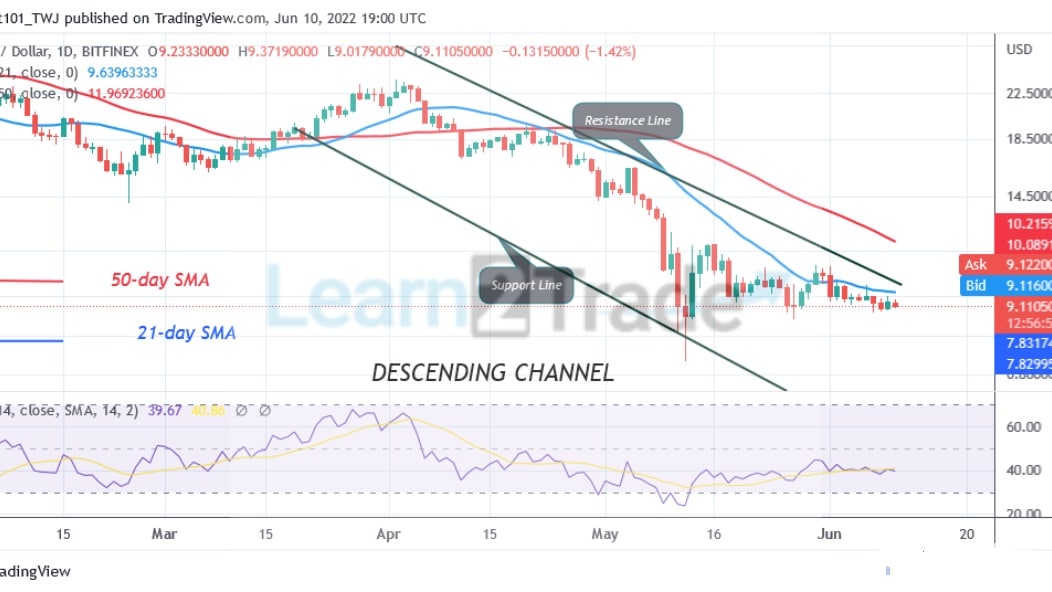
Polkadot (DOT) Price Long-term Trend: Bearish
Since June 10, Polkadot’s (DOT) price has been hovering above the $8 support as bears push to the previous low at $7.18. The downtrend will resume if the bears break below the crucial support. Nevertheless, Polkadot will decline to the previous low at $7.18 if the bears are successful. In the same, if the DOT price rebounds above the $8.00 support, the bulls will break the 21-day line SMA and rally to the 50-day line SMA. The price action of the cryptocurrency is characterized by small body indecisive candlesticks which make price movement rather very slow.
Daily Chart Indicators Reading:
DOT price is at level 37 of the Relative Strength Index for period 14. Polkadot is trading in the downtrend zone as it approaches the oversold region of the market. The price bars are below the moving averages indicating a further decline.
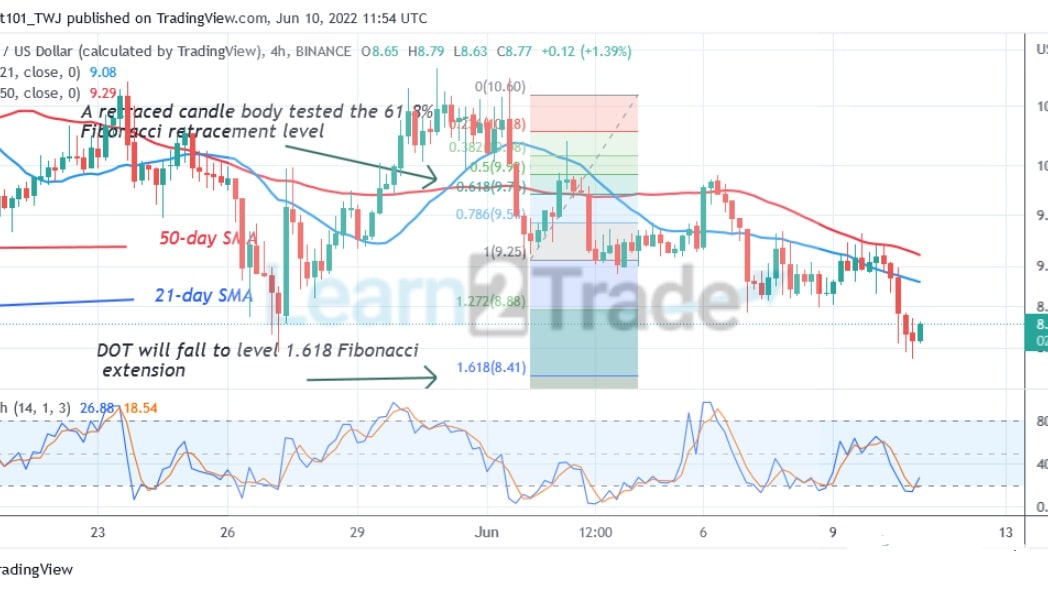
Polkadot (DOT) Medium-term Trend: Bearish
Polkadot is falling after facing rejection at the high of $10.50. DOT price is now fluctuating above the current support. The Fibonacci tool analysis will hold if the bears break below the current support. Meanwhile, on June 1 downtrend; a retraced candle body tested the 61.8% Fibonacci retracement level. The retracement suggests that DOT price will fall to level 1.618 Fibonacci extension or level $8. 41.
4-hour chart Chart Indicators Reading
The 21-day line SMA and 50-day line SMA are sloping downward indicating the downtrend. Polkadot is above the 25% range of the daily stochastic. The market is in a bullish momentum.
General Outlook for Polkadot (DOT)
DOT/USD is in a downward move as bears push to the previous low at $7.18. The current support will determine the direction of the market.
You can purchase crypto coins here. Buy LBlock
Note: Learn2.Trade is not a financial advisor. Do your research before investing your funds in any financial asset or presented product or event. We are not responsible for your investing
- Broker
- Min Deposit
- Score
- Visit Broker

- Award-winning Cryptocurrency trading platform
- $100 minimum deposit,
- FCA & Cysec regulated

- 20% welcome bonus of upto $10,000
- Minimum deposit $100
- Verify your account before the bonus is credited
- Fund Moneta Markets account with a minimum of $250
- Opt in using the form to claim your 50% deposit bonus
Learn to Trade
Never Miss A Trade Again

Signal Notification
Real-time signal notifications whenever a signal is opened, closes or Updated

Get Alerts
Immediate alerts to your email and mobile phone.

Entry Price Levels
Entry price level for every signal Just choose one of our Top Brokers in the list above to get all this free.