Polkadot (DOT) Price Long-term Trend: Bullish
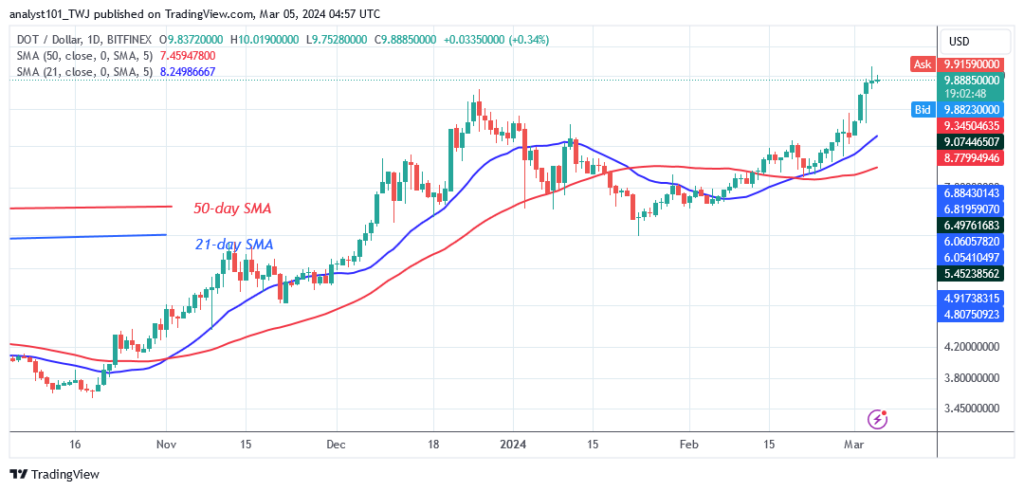
Polkadot’s (DOT) upward correction failed above the moving average lines as it remains above $9.00. On March 5, the altcoin reached a high of $10.75 but dropped sharply above the 21-day SMA. The selling pressure is moving towards the 21-day SMA.
Polkadot will fall below the moving average lines if the 21-day SMA support level is crossed. During the latest price increase, the altcoin fell below the moving average lines, hitting a low of $6.29. The altcoin is now worth $9.37.
Technical indicators:
Key Resistance Levels: $10, $12,$14
Key Support Levels: $5, $3,$1
Daily Chart Indicators Reading:
Following the current decrease, DOT price bars are now above the moving average lines. However, the selling pressure is still pointing toward the 21-day SMA. The price target will be decided when the 21-day SMA support is violated or held.
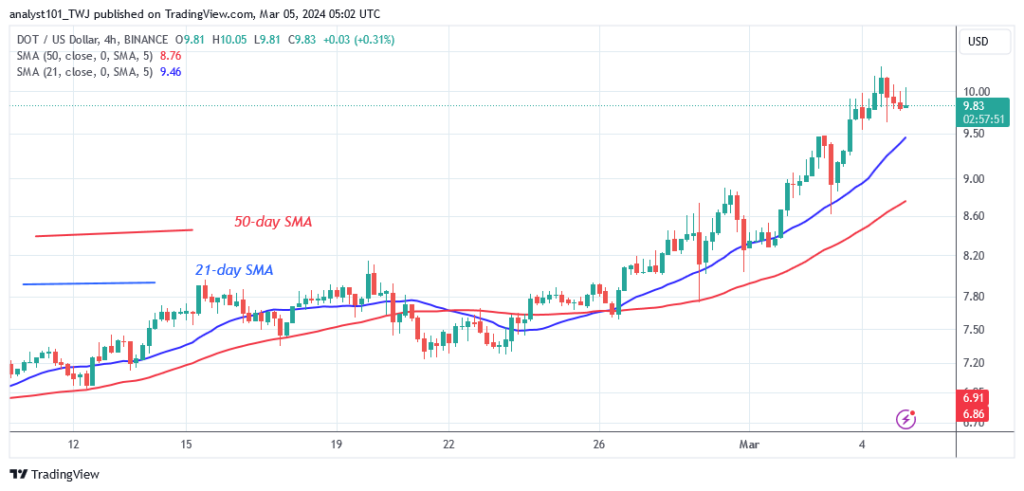
On the 4-hour chart, the DOT price is caught between the moving average lines, indicating a potential range-bound movement for the cryptocurrency.
General Outlook for Polkadot (DOT)
Polkadot is trading above the moving average lines as it remains above $9.00. The latest fall has reached the breakthrough price of $9.58. The altcoin will rise if the existing support holds. If the altcoin loses its support at $9.00, the crypto signal will become negative.
You can purchase Lucky Block – Guide, Tips & Insights | Learn 2 Trade here. Buy LBLOCK
Note: Learn2.Trade is not a financial advisor. Do your research before investing your funds in any financial asset or presented product or event. We are not responsible for your investing
- Broker
- Min Deposit
- Score
- Visit Broker

- Award-winning Cryptocurrency trading platform
- $100 minimum deposit,
- FCA & Cysec regulated

- 20% welcome bonus of upto $10,000
- Minimum deposit $100
- Verify your account before the bonus is credited
- Fund Moneta Markets account with a minimum of $250
- Opt in using the form to claim your 50% deposit bonus
Learn to Trade
Never Miss A Trade Again

Signal Notification
Real-time signal notifications whenever a signal is opened, closes or Updated

Get Alerts
Immediate alerts to your email and mobile phone.

Entry Price Levels
Entry price level for every signal Just choose one of our Top Brokers in the list above to get all this free.