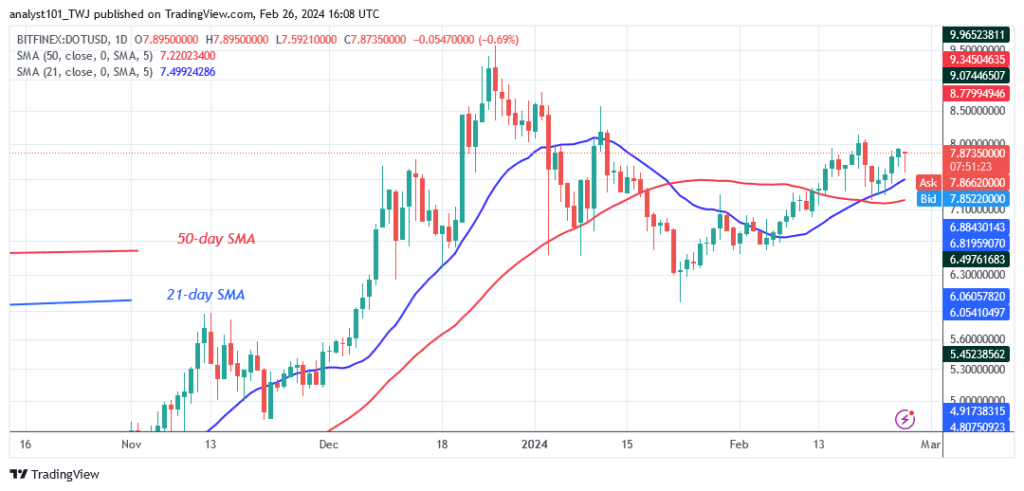
Polkadot (DOT) Price Long-term Trend: Bullish
Polkadot’s (DOT) price is above the moving average lines as it confronts the $8.10 high. Since January 11, the upward movement has been hampered by the resistance at $8.10. Today, the altcoin has risen and tested the $8.10 resistance level.
Polkadot will continue its sideways movement above the moving average lines but below the barrier around $8.10, where buyers failed to break the recent high. If buyers break over the resistance level, the DOT price will increase to its previous high of $9.58.
Meanwhile, the altcoin is experiencing a modest pullback as it confronts rejection at its recent high.
Technical indicators:
Key Resistance Levels: $10, $12,$14
Key Support Levels: $5, $3,$1
Daily Chart Indicators Reading:
Given the recent rise, the price bars are above the moving average lines. This permits the altcoin to rise above the moving average lines. The moving average lines are sloping horizontally, indicating a sideways trend.
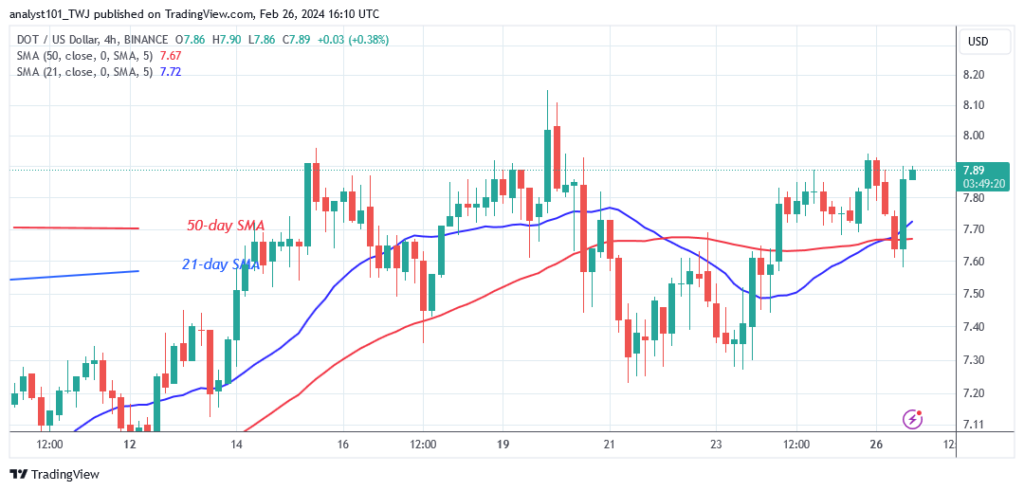
General Outlook for Polkadot (DOT)
Polkadot is in a sideways trend as it confronts the $8.10 high. On the 4-hour chart, the altcoin is trading above the moving average lines but below the resistance level of $8.10. Currently, the altcoin is trading below the resistance level of $8.10.
If buyers do not break through the barrier at $8.10, the crypto signal will remain range-bound.
You can purchase Lucky Block – Guide, Tips & Insights | Learn 2 Trade here. Buy LBLOCK
Note: Learn2.Trade is not a financial advisor. Do your research before investing your funds in any financial asset or presented product or event. We are not responsible for your investing
- Broker
- Min Deposit
- Score
- Visit Broker

- Award-winning Cryptocurrency trading platform
- $100 minimum deposit,
- FCA & Cysec regulated

- 20% welcome bonus of upto $10,000
- Minimum deposit $100
- Verify your account before the bonus is credited
- Fund Moneta Markets account with a minimum of $250
- Opt in using the form to claim your 50% deposit bonus
Learn to Trade
Never Miss A Trade Again

Signal Notification
Real-time signal notifications whenever a signal is opened, closes or Updated

Get Alerts
Immediate alerts to your email and mobile phone.

Entry Price Levels
Entry price level for every signal Just choose one of our Top Brokers in the list above to get all this free.