Key Resistance Levels: $40, $42, $44
Key Support Levels: $30,$28,$26
Polkadot (DOT) Price Long-term Trend: Ranging
For the past week, the DOT price has been rising towards the $40 overhead resistance. Today, the brief uptrend has reached bullish exhaustion. The overhead resistance is resisting a further upward move. The crypto will eventually fall because of the resistance at the recent high. This has been the price action since February 20. Each time the coin is repelled the market will fall to the lower range. DOT/USD price is fluctuating between $28 and $40. Polkadot will trend if buyers breach the $40 overhead resistance. The sideways trend will continue if the overhead resistance remained unbroken.
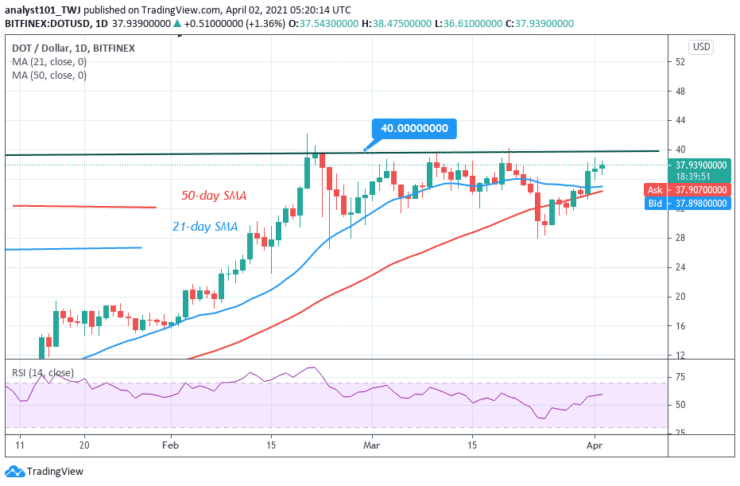
Daily Chart Indicators Reading:
The 21-day SMA and the 50-day SMA are sloping horizontally. The crypto’s price is above the SMAs which indicates a possible rise in price. DOT has risen to level 55 of the Relative Strength Index period 14. DOT is in the uptrend and is capable of rising on the upside.
Polkadot (DOT) Medium-term Trend: Bullish
On the 4-hour chart, the altcoin is in an upward move. The Fibonacci tool has indicated an upward movement of the coin. On March 31 uptrend; a retraced candle body tested the 61.8% retracement level. This retracement indicates that DOT is likely to rise to level 1.618 Fibonacci extension or the high of $41.16.
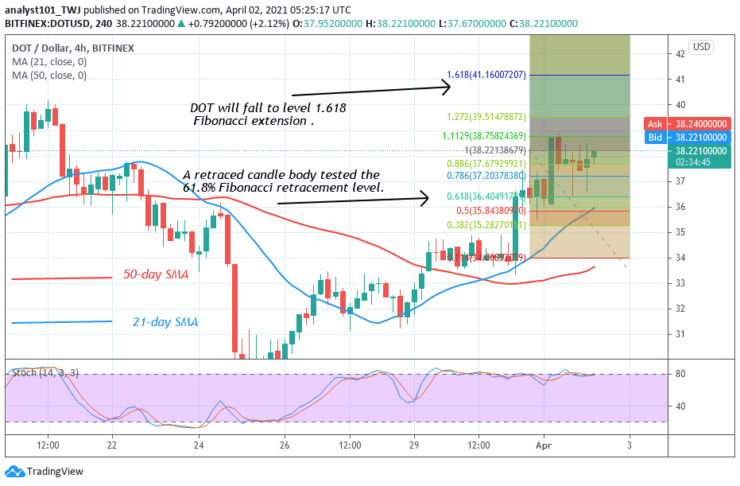
4-hour Chart Indicators Reading
The altcoin is above the 80% range of the daily stochastic. It indicates that the pair is in the overbought region. Sellers are likely to emerge in the overbought region. The SMAs are sloping upward indicating the uptrend.
General Outlook for Polkadot (DOT)
Polkadot (DOT) price is still range-bound between levels $28 and $40. The upward move is doubtful because of the resistance at $40. More so, DOT price is in the overbought region of the market. The crypto is likely to fall based on the price action.
You can purchase crypto coins here: Buy Coins
Note: Learn2Trade.com is not a financial advisor. Do your research before investing your funds in any financial asset or presented product or event. We are not responsible for your investing results
- Broker
- Min Deposit
- Score
- Visit Broker

- Award-winning Cryptocurrency trading platform
- $100 minimum deposit,
- FCA & Cysec regulated

- 20% welcome bonus of upto $10,000
- Minimum deposit $100
- Verify your account before the bonus is credited
- Fund Moneta Markets account with a minimum of $250
- Opt in using the form to claim your 50% deposit bonus
Learn to Trade
Never Miss A Trade Again

Signal Notification
Real-time signal notifications whenever a signal is opened, closes or Updated

Get Alerts
Immediate alerts to your email and mobile phone.

Entry Price Levels
Entry price level for every signal Just choose one of our Top Brokers in the list above to get all this free.