Key Resistance Levels: $40, $42, $44
Key Support Levels: $30,$28,$26
Polkadot (DOT) Price Long-term Trend: Ranging
On March 20, DOT attempted to breach the $40 resistance but were repelled. Consequently, the bears push the crypto to $28 low. This resulted in breaking the lower price range. The recent support is holding as bulls buy the dips. This is a bullish signal for range-bound traders who can initiate long trades at the lower price range. This trade can be exited near the resistance zone. Nevertheless, if the bulls face rejection at the resistance zone, a short trade can also be initiated. This can be closed near the support zone. This trading can be done consistently until the coin resumes trending.
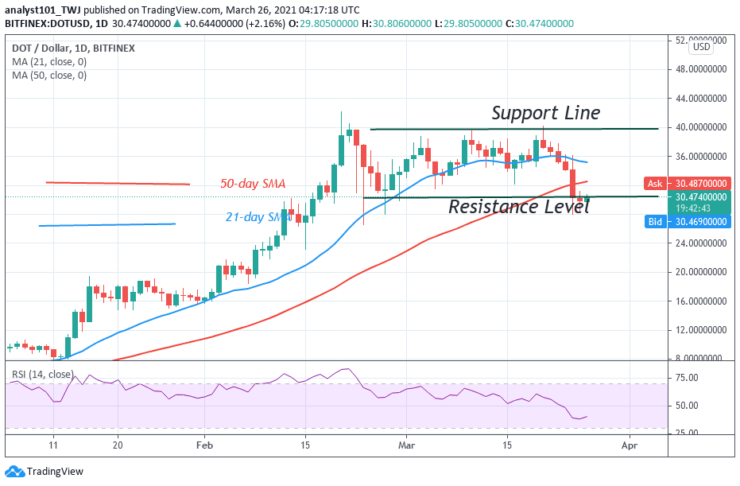
Daily Chart Indicators Reading:
The 21-day SMA and the 50-day SMA are sloping horizontally. DOT is fallen to level 40 of the Relative Strength Index period 14. This indicates that the pair is in the downtrend zone. It is likely to fall as it is in the bullish trend zone.
Polkadot (DOT) Medium-term Trend: Bearish
On the 4-hour chart, the altcoin is in a downward move. The crypto has already fallen to the $28 low. The Fibonacci tool has indicated a further downward movement of price if the current support is breached. On March 24 downtrend, the crypto dropped to $28. The retraced candle body tested the 78.6% retracement level. This indicates that DOT is likely to fall to level 1.272 Fibonacci extension or the low of $25.92.
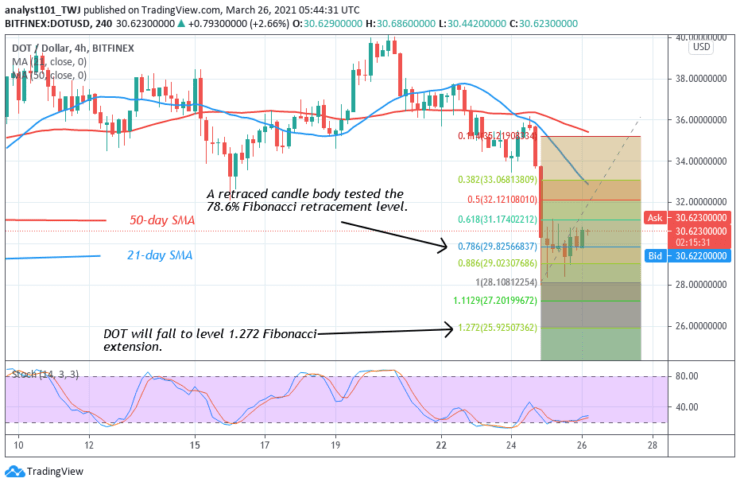
4-hour Chart Indicators Reading
The altcoin is above the 25% range of the daily stochastic. It indicates that the pair is in a bullish momentum. The SMAs are sloping southward indicating the downtrend.
General Outlook for Polkadot (DOT)
Polkadot (DOT) has fallen to the lower price range. If the support holds, the range-bound movement will resume. DOT is trading at $30.68 at the time of writing. From every indication the range-bound movement will continue as there are bullish signals.
You can purchase crypto coins here: Buy Coins
Note: Learn2Trade.com is not a financial advisor. Do your research before investing your funds in any financial asset or presented product or event. We are not responsible for your investing results
- Broker
- Min Deposit
- Score
- Visit Broker

- Award-winning Cryptocurrency trading platform
- $100 minimum deposit,
- FCA & Cysec regulated

- 20% welcome bonus of upto $10,000
- Minimum deposit $100
- Verify your account before the bonus is credited
- Fund Moneta Markets account with a minimum of $250
- Opt in using the form to claim your 50% deposit bonus
Learn to Trade
Never Miss A Trade Again

Signal Notification
Real-time signal notifications whenever a signal is opened, closes or Updated

Get Alerts
Immediate alerts to your email and mobile phone.

Entry Price Levels
Entry price level for every signal Just choose one of our Top Brokers in the list above to get all this free.