Key Resistance Levels: $60, $62, $64
Key Support Levels: $40,$38,$36
Polkadot (DOT) Price Long-term Trend: Bullish
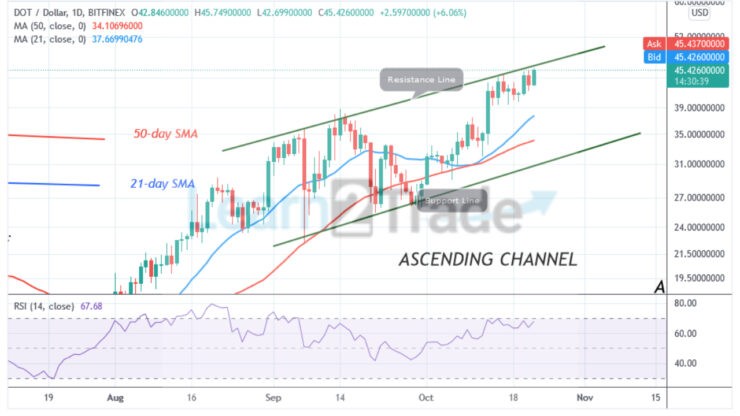
Today, Polkadot’s (DOT) price has been struggling to sustain above the $45 high. Buyers have made two attempts to break above the recent high. In the first attempt, Polkadot was resisted as it fell to $44.90 support. Nevertheless, after the second retest, the altcoin slumped above the $45 support. The current price action has remained the same since October 20. The cryptocurrency will rally to $50 high if the bulls are successful above the recent high. However, if the bulls fail to sustain the bullish momentum, the DOT price will decline to $34 low.
Daily Chart Indicators Reading:
Polkadot is at level 68 of the Relative Strength Index period 14. The market is near the overbought region. DOT/USD has not enough room to rally on the upside. The 21-day and 50-day SMAs are sloping upward indicating the uptrend.
Polkadot (DOT) Medium-term Trend: Bullish
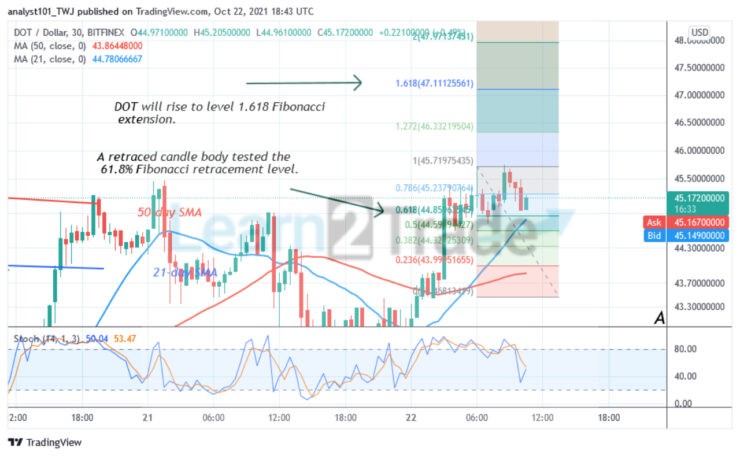
The altcoin has been struggling to sustain above $45 support. The cryptocurrency will resume an upward move if the current bullish momentum is sustained. Today, the upward move has been repelled. Meanwhile, on October 22 uptrend; a retraced candle body tested the 61.8% Fibonacci retracement level. The retracement indicates that DOT price will rise to level 1.618 Fibonacci extensions or $47.11.
4-hour Chart Indicators Reading
DOT is below the 40% range of the daily stochastic but the stochastic bands are sloping upward. The 21-day SMA and the 50-day SMA are sloping upward indicating the uptrend. Polkadot has a bullish crossover as the 21-day SMA crosses above the 50-day SMA.
General Outlook for Polkadot (DOT)
Polkadot’s (DOT) price is in an upward move. The chances of rising are there as long as the price bars are above the moving averages. Buyers have to breach the $46 resistance zone to resume the upward move.
You can purchase crypto coins here: Buy Coins
Note: Learn2Trade.com is not a financial advisor. Do your research before investing your funds in any financial asset or presented product or event. We are not responsible for your investing results
- Broker
- Min Deposit
- Score
- Visit Broker

- Award-winning Cryptocurrency trading platform
- $100 minimum deposit,
- FCA & Cysec regulated

- 20% welcome bonus of upto $10,000
- Minimum deposit $100
- Verify your account before the bonus is credited
- Fund Moneta Markets account with a minimum of $250
- Opt in using the form to claim your 50% deposit bonus
Learn to Trade
Never Miss A Trade Again

Signal Notification
Real-time signal notifications whenever a signal is opened, closes or Updated

Get Alerts
Immediate alerts to your email and mobile phone.

Entry Price Levels
Entry price level for every signal Just choose one of our Top Brokers in the list above to get all this free.