
Polkadot (DOT) Price Long-term Trend: Bullish
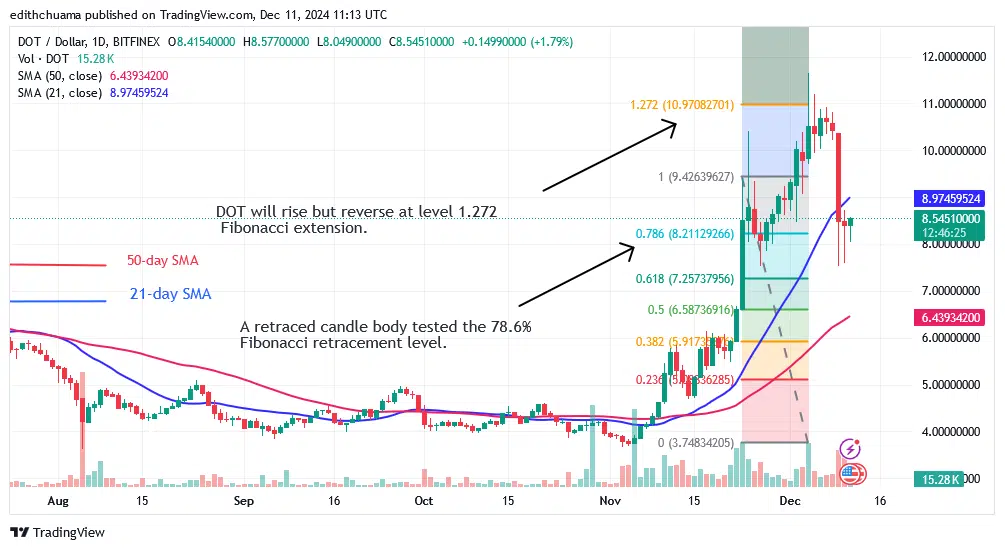
Polkadot’s (DOT) price has fallen below the 21-day SMA but rises above the $8.00 support. The cryptocurrency was repulsed at the $11 high before declining and finding support above the 78.6% Fibonacci retracement level, or the $8.21 low. The altcoin trades below the 21-day SMA and above the 50-day SMA support. Polkadot will resume its bullish trend whenever it breaks above the 21-day SMA.
Technical indicators:
Key Resistance Levels: $10, $12, $14
Key Support Levels: $5, $3, $1
Polkadot Indicator Analysis
There are long candlestick tails below the 21-day SMA support, indicating significant buying pressure at the current level. The cryptocurrency price falls between the moving average lines. Buyers are seeking to keep the price above the 21-day SMA following the latest drop. Despite recent declines, the moving average lines are heading upward.
General Outlook for Polkadot (DOT)
Polkadot is declining below the moving average lines but rises above the $8.00 support . The selling pressure has eased as the altcoin regains positive momentum. The current upward movement will encounter resistance at the moving average lines. If the bullish scenario is invalidated, the altcoin will be forced to trade in a range above the present support level of $7.50 and below the moving averages.

Make money without lifting your fingers: Start using a world-class auto trading solution.
Note: Learn2.Trade is not a financial advisor. Do your research before investing your funds in any financial asset or presented product or event. We are not responsible for your investment.


