
Polkadot (DOT) Price Long-term Trend: Bullish
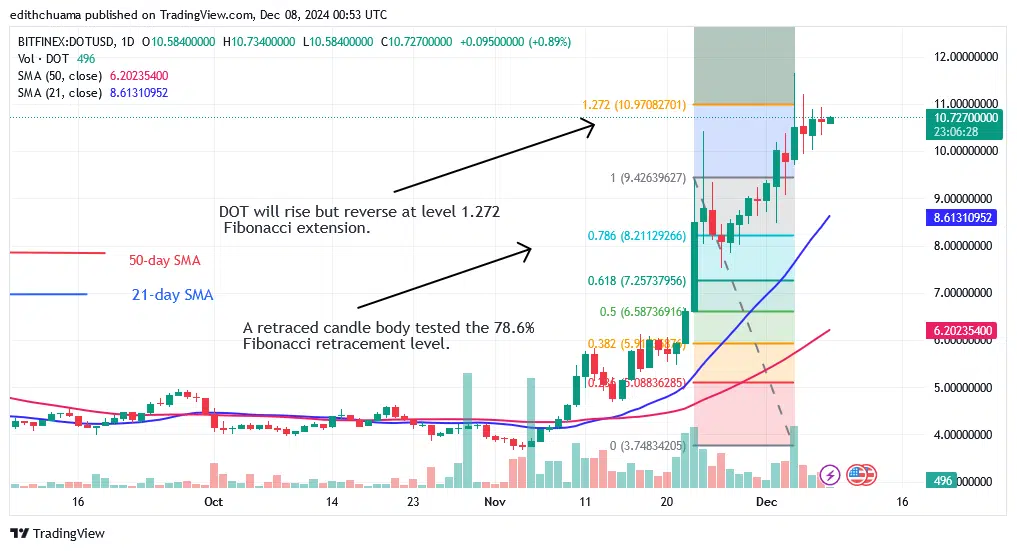
Polkadot’s (DOT) price has risen from the bottom of the chart to a high of $10.66 but risks decline below $11.00. This marks the second time the altcoin has rallied to the $11 resistance zone. On March 11, the altcoin reached a high of $11.85 before being repelled. The altcoin fell to the bottom of the chart but held above its $3.67 low. Bulls bought the dips, propelling the altcoin above its moving average lines.
Technical indicators:
Key Resistance Levels: $10, $12, $14
Key Support Levels: $5, $3, $1
Polkadot Indicator Analysis
The price bars are above the upward-sloping moving average lines. The 21-day SMA is near the price bars, which suggests a possible decrease. The presence of Doji candlesticks causes the altcoin to consolidate above the current support. Price movement has been influenced by Doji candlesticks, which limit price movement.
General Outlook for Polkadot (DOT)
Polkadot is currently in an uptrend on the 4-hour chart but risks decline below $11.00. The bullish momentum has halted around the high of $11.65. DOT prices are now oscillating above $9.90 and $11.50. The upward movement has paused as the DOT price consolidates above the $9.90 barrier. The crypto signal is good, with the altcoin trading above the moving average lines.

Make money without lifting your fingers: Start using a world-class auto trading solution.
Note: Learn2.Trade is not a financial advisor. Do your research before investing your funds in any financial asset or presented product or event. We are not responsible for your investment.


