The platinum market has seen a notable price recovery over the past week, suggesting significant improvement in market activity. This recovery appears to be driven by easing U.S. trade tariffs. As a result, most stocks have experienced a decent rebound during the same period.
Key Price Levels
Resistance Levels: $975, $1,000, $1,020
Support Levels: $920, $900, $875
Platinum Heads Northward But Faces Resistance
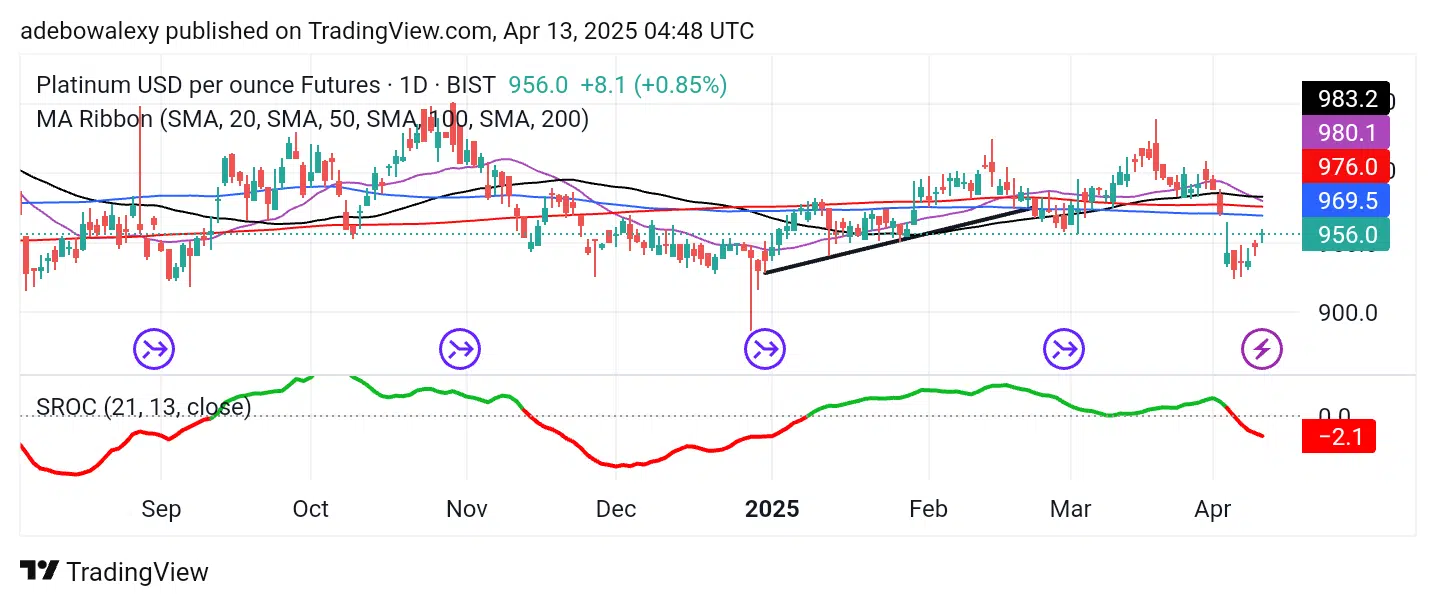
The XPT market appears somewhat choppy, but despite this, price activity has been steadily moving upward. The most recent price candle on the chart is green but has contracted significantly, indicating that bullish momentum is still present but facing resistance.
Additionally, price action remains below all the Moving Average (MA) lines. The Stochastic Rate of Change (SROC) indicator lines are positioned below the equilibrium level and appear to be shifting sideways in response to growing upward momentum.

XPT Maintains an Upward Trajectory
The 4-hour platinum chart continues to exhibit choppy characteristics. Nevertheless, the overall trend appears to be upward. Unlike the daily chart, price action on this chart has moved above the 20-day MA line. The last candle is red, which explains the contraction seen on the daily chart.
Furthermore, while the SROC lines are still below the equilibrium level, they are now tilting upward toward the 0.00 mark. This suggests the market may be heading back toward the $1,000 threshold.
Make money without lifting your fingers: Start trading smarter today
- Broker
- Min Deposit
- Score
- Visit Broker

- Award-winning Cryptocurrency trading platform
- $100 minimum deposit,
- FCA & Cysec regulated

- 20% welcome bonus of upto $10,000
- Minimum deposit $100
- Verify your account before the bonus is credited
- Fund Moneta Markets account with a minimum of $250
- Opt in using the form to claim your 50% deposit bonus
Learn to Trade
Never Miss A Trade Again

Signal Notification
Real-time signal notifications whenever a signal is opened, closes or Updated

Get Alerts
Immediate alerts to your email and mobile phone.

Entry Price Levels
Entry price level for every signal Just choose one of our Top Brokers in the list above to get all this free.