Don’t invest unless you’re prepared to lose all the money you invest. This is a high-risk investment and you are unlikely to be protected if something goes wrong. Take 2 minutes to learn more
The Orchid token has appeared second on the daily trending cryptocurrencies list after its price moved by 2.43%. Its trading chart revealed that the token has only presented minimal gains, which appear to be increasing in magnitude over the past two sessions.
OXT Statistics:
Orchid Value Now: $0.0641
OXT Market Cap: $61,818,080
OXT Circulating Supply: 962,629,339
Orchid Total Supply: 1,000,000,000
Orchid CoinMarketCap Ranking: 311
Major Price Levels:
Top: $0.0641, $0.0700, and $0.0750
Base: $0.0601, $0.0550, and $0.0500
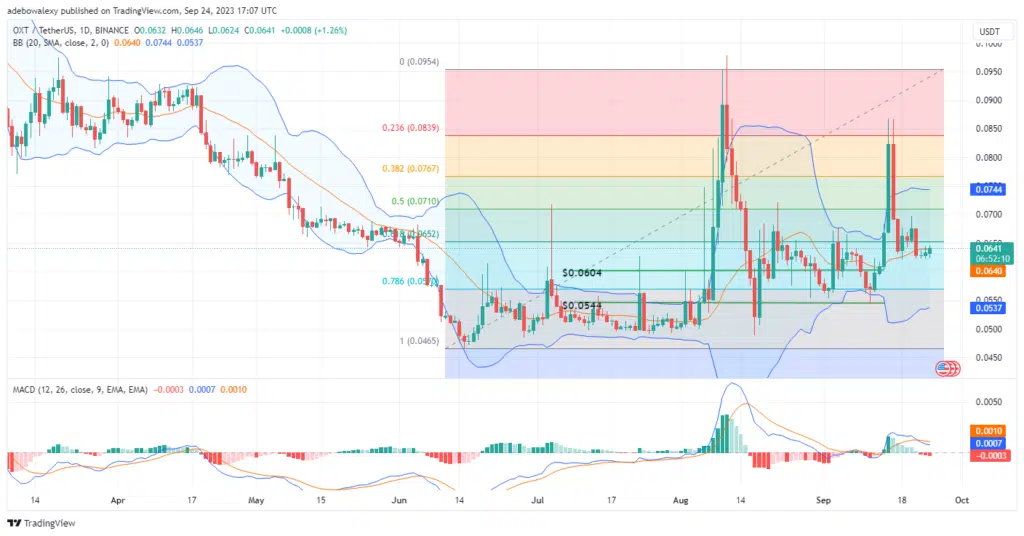
Orchid Eyes a Nearby Resistance at the $0.0650 Mark
The Orchid token has printed some profits in today’s trading activity. Although the printed profits appear quite small, it can be seen that the magnitude of the profits has been increasing gradually over the past two trading sessions. The ongoing session has brought the token to pipe through the limit formed by the middle band of the Bollinger Bands indicator.
As a result, OXT now trades above the $0.0640 mark, though by a thin line. Nevertheless, the MACD bars stay solid red, which indicates that donward forces are of considerable strength. But on the contrary, the lines of the same indicator seem to have a sideways path, reflecting the efforts of buyers in the market over the past two sessions. Consequently, this may be hinting that the upside correction may extend.
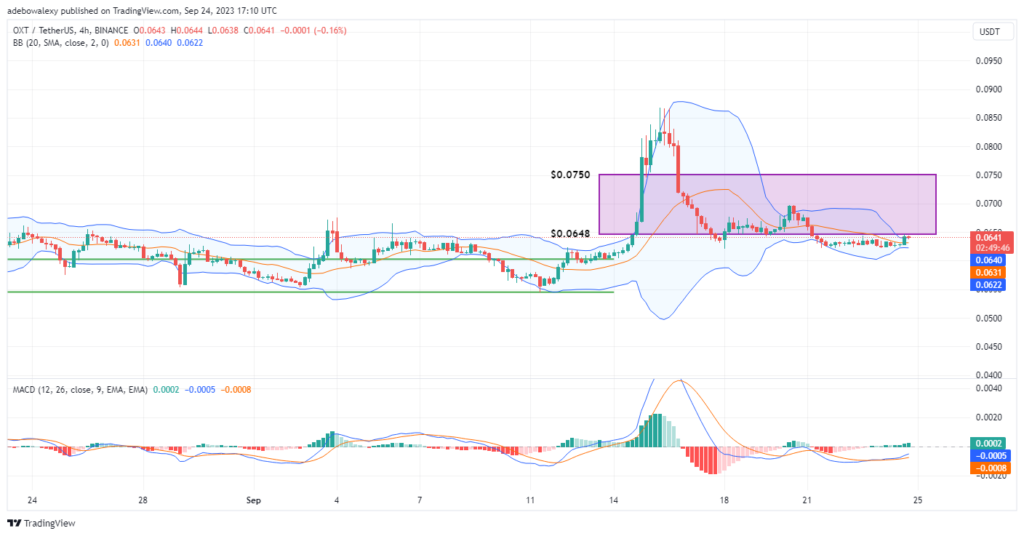
OXT Has a Winning Chance against Headwinds
Indications from the OXTUSDT 4-hour market support the opinion that a tailwind may be building up in this market. Here, it could be observed that the applied Bollinger Bands indicator has narrowed up. Meanwhile, trading activities continue to occur above the middle limit of the indicator. Likewise, the Moving Average Convergence Divergence MACD indicator bars stayed green and kept growing taller.
Additionally, the line of the indicator is also rising smoothly toward the equilibrium level from below it. Although a tiny red price candle has appeared for the latest session on this chart, technical indicators seem more in favor of this token trading between the $0.0650 and $0.0750 price level soon.
- Broker
- Min Deposit
- Score
- Visit Broker

- Award-winning Cryptocurrency trading platform
- $100 minimum deposit,
- FCA & Cysec regulated

- 20% welcome bonus of upto $10,000
- Minimum deposit $100
- Verify your account before the bonus is credited
- Fund Moneta Markets account with a minimum of $250
- Opt in using the form to claim your 50% deposit bonus
Learn to Trade
Never Miss A Trade Again

Signal Notification
Real-time signal notifications whenever a signal is opened, closes or Updated

Get Alerts
Immediate alerts to your email and mobile phone.

Entry Price Levels
Entry price level for every signal Just choose one of our Top Brokers in the list above to get all this free.