

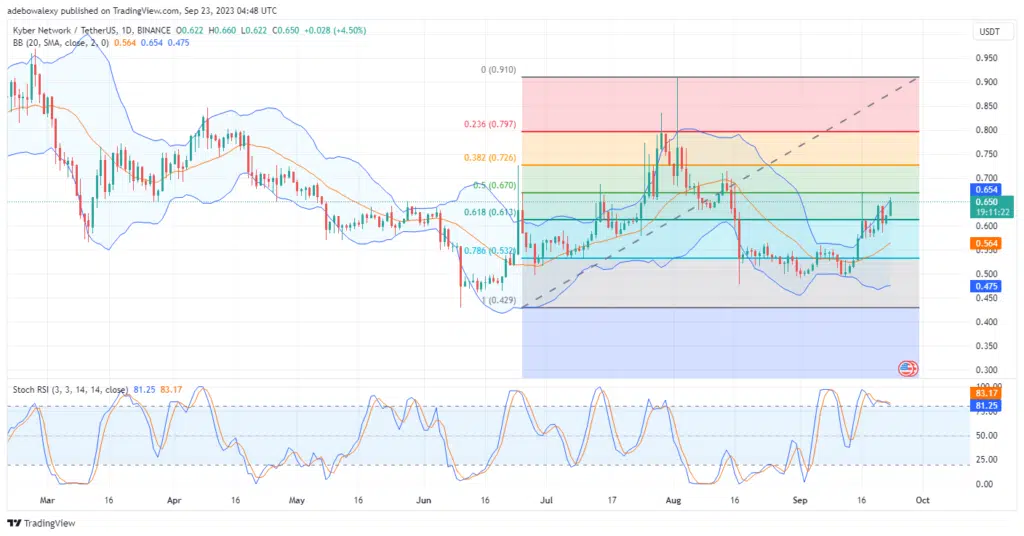
After the Kyber Network price action popped through the ceiling formed by the $0.613 mark, another session began with the token rising further. However, technical indicators at some point seems divergent. Lets get a closer view of things.
KNC Statistics:
KNC Value Now: $0.650
Kyber Network Market Cap: $110,462,017
Kyber Network Circulating Supply: —
KNC Total Supply: —
KNC CoinGhecko Ranking: 214
Major Price Levels:
Top: $0.650, $0.700, and $0.750
Base: $0.600, $0.550, and $0.500
Kyber Network May Be Eying the $0.700 Mark
Price action in the Kyber Network daily market has continued to march upward with considerable momentum. Another trading session has started, and buyers are taking the lead with significant control early enough. Even the Bollinger Bands are now tilted in the upside direction in acknowledgment of the current price trend.
However, the Relative Strength Index (RSI) lines seem a bit divergent on this. This can be observed as the indicator lines are trending slightly downward, towards the 80 level of the indicator. This suggests that traders should exercise some caution at this point.

KNC Looks Fairly up for More Gains
Meanwhile, the RSI lines continue to reach strongly into the overbought region. The distance between the leading and lagging lines is significant and suggests that upside momentum is fairly strong. Therefore, traders can anticipate the upside correction to continue towards 0.675 mark at least, but more may be expected from this market.


