Don’t invest unless you’re prepared to lose all the money you invest. This is a high-risk investment and you are unlikely to be protected if something goes wrong. Take 2 minutes to learn more
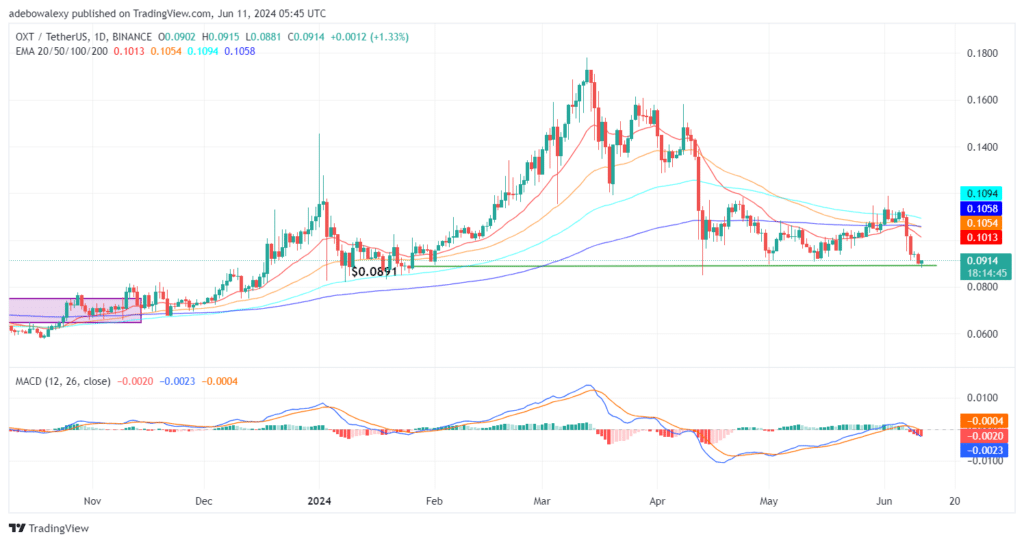
Even though the Orchid token appears in the 2nd spot of today’s crypto top gainer list, it can be seen that price action in this market has reached depths not seen in the past 5 months. At the moment, it appears that the support level from 5 months ago is still trying to breach the downward correction in this market.
Key Price Levels:
Resistance: $0.0950, $0.1150, and $0.1400
Support: $0.0900, $0.0700, and $0.0500
Orchid Buyers May Have Regrouped at the $0.0891 Support
OXT price movement on the daily chart has rebounded off a 5-month-old support level in the ongoing session. This occurred after price action in the market fell under the control of headwinds about five trading sessions ago. This caused a significant downward price correction, which brought the price to the depth it has reached today.
However, a minimal rebound has occurred in today’s session, holding hope that the downtrend may be abated. Nevertheless, the market still seems under the control of headwinds, according to technical indicators. Trading in this market is occurring below all the Exponential Moving Average (EMA) curves. Also, the Moving Average Convergence Divergence (MACD) lines are falling downward towards the sub-equilibrium level. All these suggest that headwinds still have the upper hand.
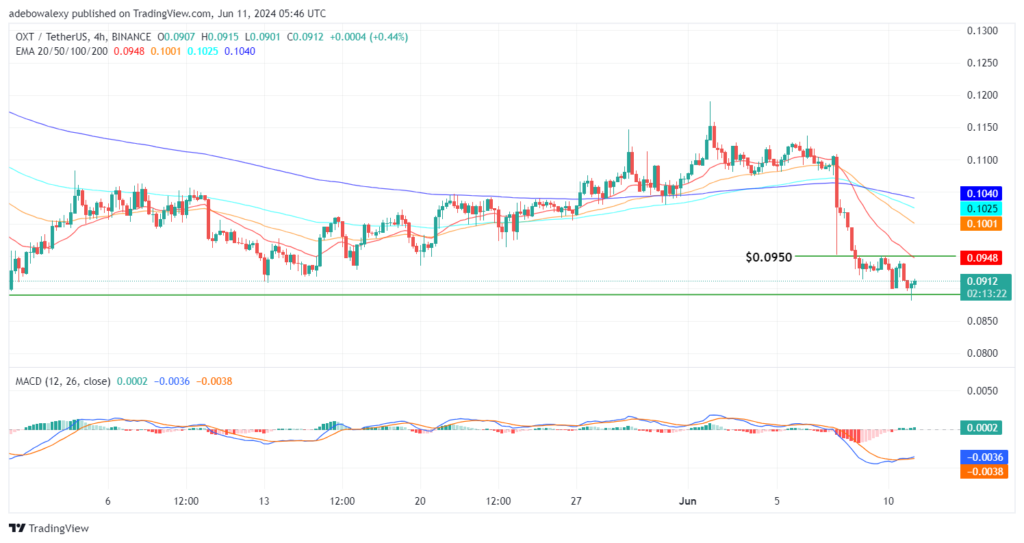
OXT May Be Eyeing an Upside Recovery Toward the $0.0950 Mark
The earlier mentioned upside rebound off 5-month-old support in the Orchid market has also been seen on the token’s 4-hour market chart. Here, price action seems to be more clearly portrayed. The mentioned upside correction has continued for the second consecutive session in the 4-hour market timeframe. Nevertheless, trading activities are still below the EMA lines, showing that upside forces are still in dangerous territories.
Meanwhile, the MACD indicator lines are below the centerline and have a slight upward trajectory. The bars of the indicator are tiny but have appeared solid green since the previous session. Consequently, traders may only hope to print gains within regions below the EMA lines in the meantime. Therefore, bullish crypto signals with a target at the $0.0950 mark may be realistic. Otherwise, targets below the current support may be worth a try.
Trade on MT4 with Leverage up to 1:500! Trade on MT4 with Leverage up to 1:500!
X
We use cookies to ensure that we give you the best experience on our website. If you continue to use this site we will assume that you are happy with it.