Don’t invest unless you’re prepared to lose all the money you invest. This is a high-risk investment and you are unlikely to be protected if something goes wrong. Take 2 minutes to learn more
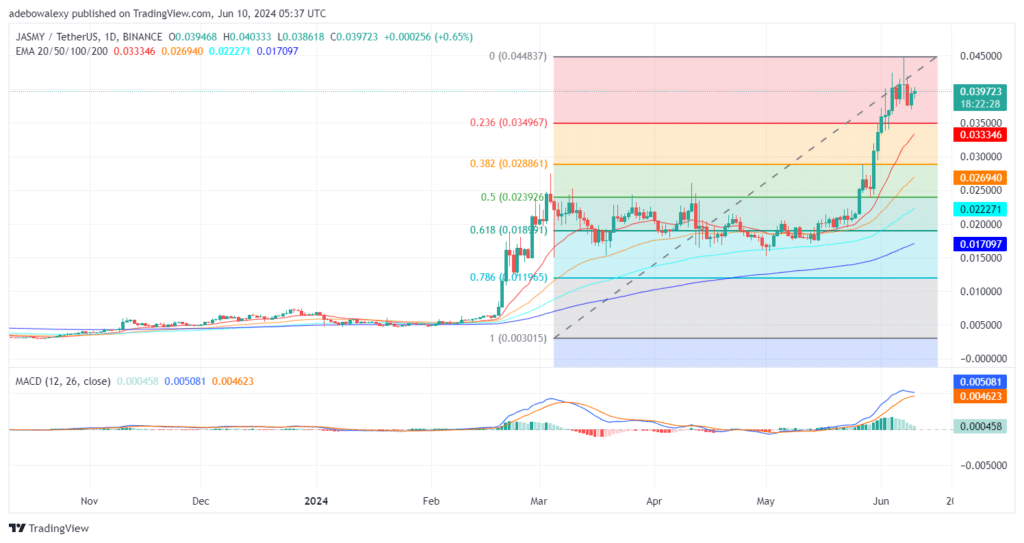
Price action in the JASMY/USDT daily market has been hovering around the price resistance level of $0.04000. However, downward forces have been able to restrain the market from progressing considerably past this mark. Nevertheless, technical indicators are still favoring bullish opinions in this market.
Key Price Levels:
Resistance: $0.04250, $0.04500, and $0.05000
Support: $0.03700, $0.03500, and $0.03000
.04000 Price Level" width="580" height="308" data-lazy-src="https://learn2.trade/wp-content/uploads/2024/06/JASMYUSDT_2024-06-10_06-37-33_064156-1024x543.png"/>
Market Forces Are Locking Horns in the JASMY/USDT Daily Market
Price movement in the daily JASMY/USDTmarket retreated below the $0.04000 mark in the past two sessions. However, the token recorded a moderate recovery in the previous session, while today’s trading so far has continued the trend. Be that as it may, we can see that the current session is under tension, as indicated by the corresponding price candle.
The body of the mentioned price candle is centrally positioned, while the upper and lower shadows are almost equal in length. Nevertheless, upside hopes are still viable, as price action stands above all the Exponential Moving Average (EMA) lines. The Moving Average Convergence Divergence (MACD) lines are still above the equilibrium level, with the more recent part of their lines now sideways.
.04000 Price Level" width="580" height="308" data-lazy-src="https://learn2.trade/wp-content/uploads/2024/06/JASMYUSDT_2024-06-10_06-41-07_064154-1024x543.png"/>
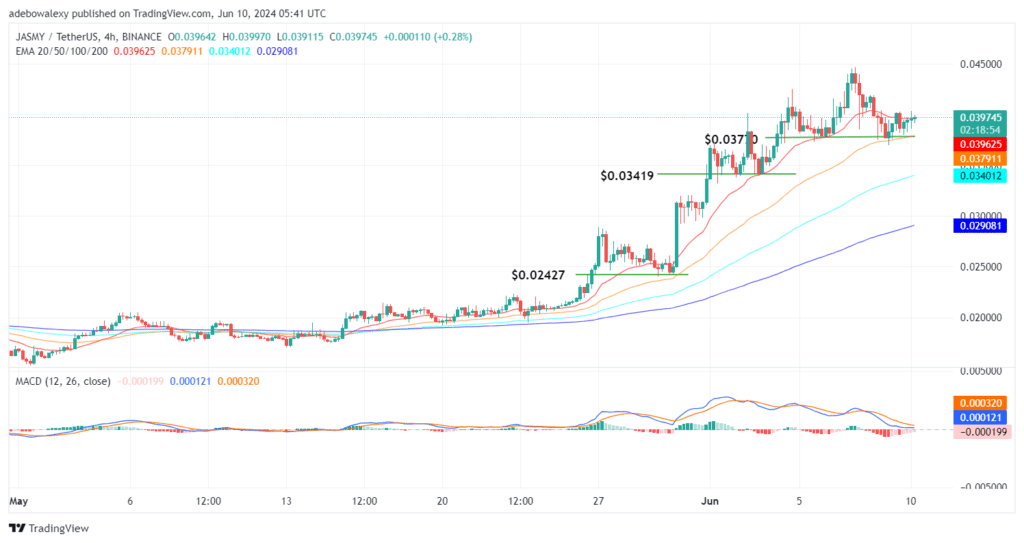
The JASMY/USDT Market Eyes Breaking Above a Technical Price Line
Coming to the Jasmy 4-hour market, it can be seen that price action maintains its bullish propensity. More recently, price action has rebounded off the $0.03770 price level. The market has kept on an upward trajectory since then, even though the momentum seems to have decreased. The last price candle on this price chart has popped through the 20-day EMA line.
Consequently, this maintains the fact that price action may extend the upside correction further upwards. Here, the MACD indicator lines are above the equilibrium level and are attempting to remain above it by delivering a bullish crossover. This will eventually strengthen the bullish traction, pushing the market further towards the $0.04250 level. Traders can still make use of crypto signals targeting that price level in this market.
Trade on MT4 with Leverage up to 1:500! Trade on MT4 with Leverage up to 1:500!
X
We use cookies to ensure that we give you the best experience on our website. If you continue to use this site we will assume that you are happy with it.
 .04000 Price Level" width="580" height="308" data-lazy-src="https://learn2.trade/wp-content/uploads/2024/06/JASMYUSDT_2024-06-10_06-37-33_064156-1024x543.png"/>