Don’t invest unless you’re prepared to lose all the money you invest. This is a high-risk investment and you are unlikely to be protected if something goes wrong. Take 2 minutes to learn more
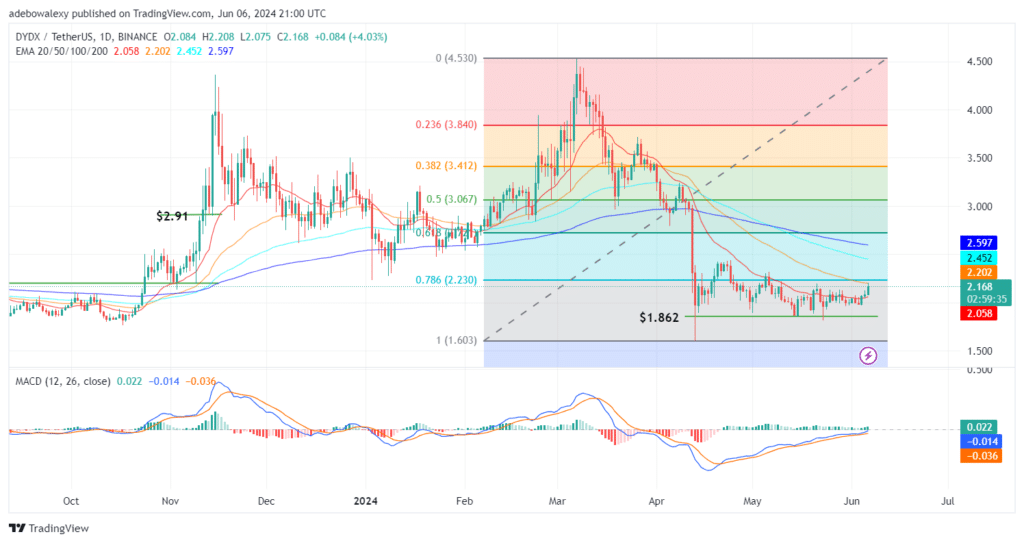
The DYDXUSDT market has been largely trading between the $2.230 and $1.862 price levels. The market has been within this range since the last price crash in April. Today’s trading activity has neen trying to gather some escape velocity needed to exit the gravitational pull below the $2.230 price mark.
Key Price Levels:
Resistance: $2.500, $3.000, and $3.500
Support: $2.000, $1.500, and $1.000
dYdX Bulls Are Standing Strong
The price candle corresponding to the current session in the DYDX daily market reveals that upside forces are holding out quite well against headwinds. The last price candle on this chart has advanced the market further up from above the 50-day Exponential Moving Average (EMA) curve.
However, an upper shadow has appeared at the close of the price candle, indicating that downward forces are trying to resist bullish progress. Be that as it may, the Moving Average Convergence Divergence (MACD) lines have an upside trajectory below the equilibrium level. The bars of the indicator are green above the equilibrium level, hinting that upside forces are still active in this market.
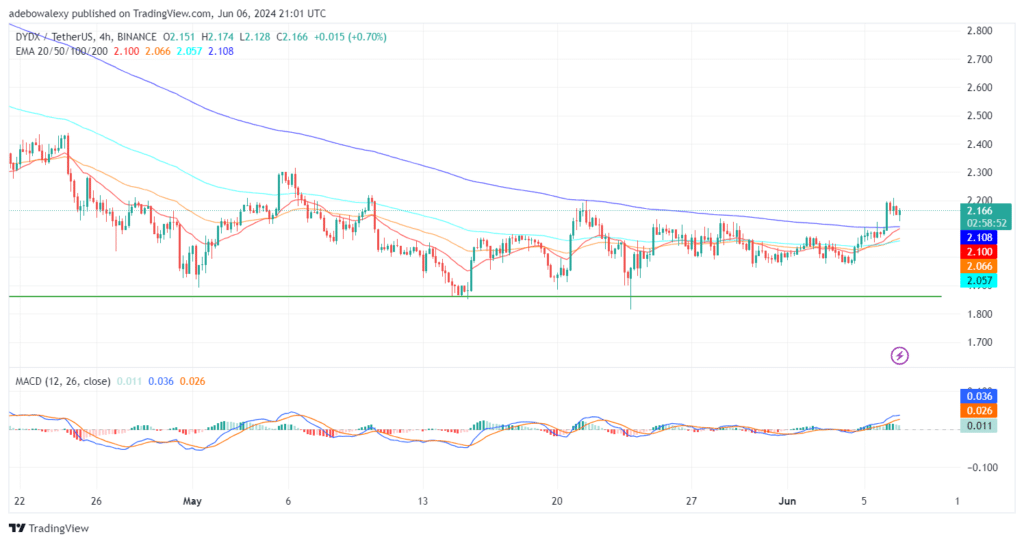
DYDXUSDT Market Corrects Off Resistance at $2.200
Although upside forces in the dYdX market have made some impressive moves, we can see that the market has just been rejected at the $2.200 mark on the 4-hour chart. Nevertheless, the token continues trading above all the EMA lines. Consequently, this offers some hope to tailwinds. However, the ongoing session has printed some gains, minimal or not. The MACD indicator lines can be seen trending upward in a staggered manner.
The behavior of the indicator lines is further explained by the pale green appearance of the MACD bars. Although the market has corrected downwards off a key resistance, the upward trajectory of the MACD above the equilibrium level, coupled with the appearance of price action above all the EMA lines, suggests that the market has an upside potential towards the $2.500 price level. So, crypto signals with targets near that mark can still be utilized in this market.
Trade on MT4 with Leverage up to 1:500! Trade on MT4 with Leverage up to 1:500!
X
We use cookies to ensure that we give you the best experience on our website. If you continue to use this site we will assume that you are happy with it.