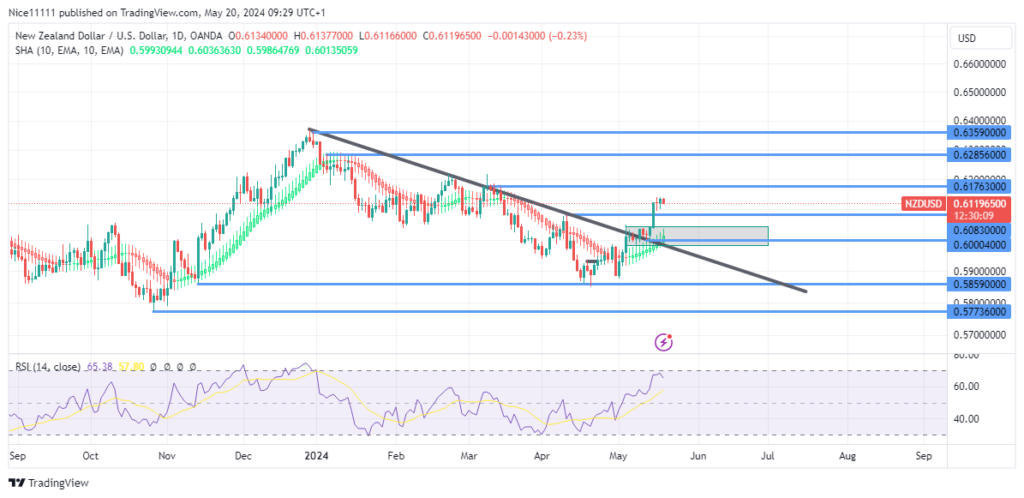
The NZDUSD pair is displaying a clear bullish trend following the break of the resistance trendline on the daily chart. The market is now poised to target the rich liquidity regions on the sell-side, particularly around the relative equal highs.
NZDUSD Key Levels
Demand Levels: 0.6000, 0.5860, 0.5770
Supply Levels: 0.6180, 0.6290, 0.6360
NZDUSD Long-term Trend: Bullish
The significant price decline below the major low of 0.6120 in January set the stage for a downtrend in NZDUSD, with the formation of lower highs reinforcing the bearish market structure. This downtrend was marked by a series of lower highs aligned along a bearish trendline, prompting sell-offs at each test of the trendline.
However, as the price approached the demand zone at 0.5860, the daily candles began forming higher lows, indicating a shift in momentum. Notably, while the price made a lower low, the RSI (Relative Strength Index) formed a higher low, signaling underlying strength. This divergence, coupled with a bounce off the 0.5860 demand zone, suggested a failed low and a potential reversal. The swing low at the beginning of May was higher than the previous low, confirming the bullish shift. The RSI now shows a strong upward trend, which aligns with bullish signals from the Smoothed Heikin Ashi Candles.
NZDUSD Short-term Trend: Bullish
In the short term, a double top pattern is evident at the supply zone of 0.6180. The relative equal highs at this level are attractive targets for forex traders. While a pullback to the 0.6000 demand zone, where a bullish order block is located, is possible, the overall expectation is for the price to advance towards the 0.6180 supply zone shortly.
Trade on MT4 with Leverage up to 1:500! Trade on MT4 with Leverage up to 1:500!
X
We use cookies to ensure that we give you the best experience on our website. If you continue to use this site we will assume that you are happy with it.

 NZDUSD Short-term Trend: Bullish
 NZDUSD Short-term Trend: Bullish


