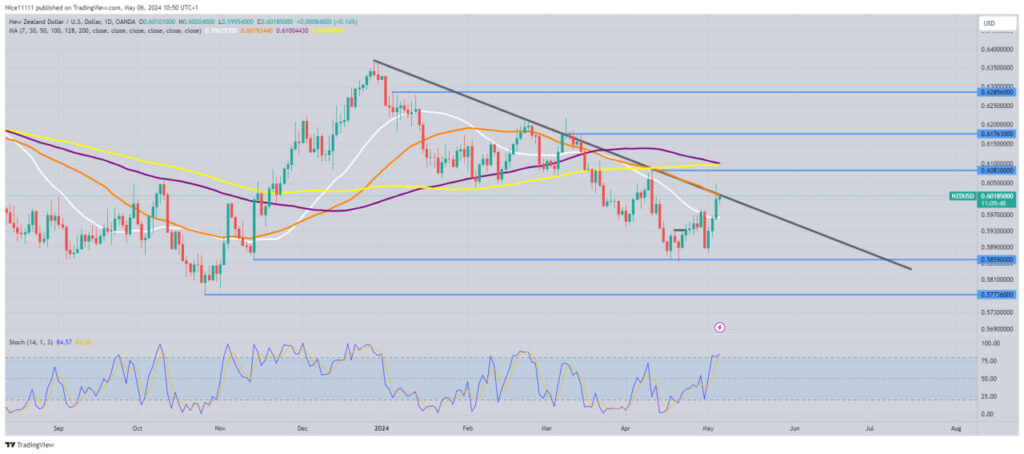
The NZDUSD market has undergone a notable shift, with an ascent into overbought region. This movement follows a bearish trajectory from the swing high of 0.6080 to the demand level of 0.5860. The recent price dynamics suggest a countertrend motion, indicating a potential resumption of the downward trend, especially as the price hovers within the overbought zone.
NZDUSD Key Levels
Demand Levels: 0.5860, 0.5770, 0.5730
Supply Levels: 0.6080, 0.6180, 0.6290
NZDUSD Long-term Trend: Bearish
The NZDUSD market structure on the daily chart maintains a bearish stance, marked by unbreached significant highs and lower lows, indicative of the prevailing downward trajectory. Presently, the price resides below the Long-term Moving Averages of periods 100 and 128, further confirming the bearish sentiment. Additionally, the presence of a bearish trendline reinforces the downward momentum.
A bullish reversal was observed at the demand level of 0.5860, characterized by a double bottom formation, followed by the emergence of three white soldiers, signalling a potential short-term uptrend. The price has surpassed the Short-term Moving Averages (Periods 30 and 50), indicating an upward movement in the short term.
NZDUSD Short-term Trend: Bullish
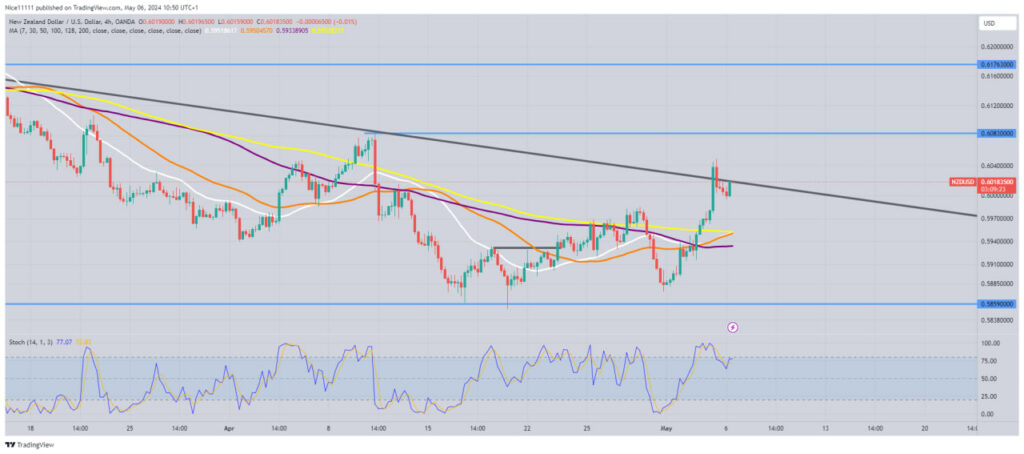
On the 4-hour timeframe, the Stochastic oscillator indicates an overbought condition, consistent with the daily chart’s observation. Moreover, the price has tested the resistance trendline, signalling a potential reversal. Notably, the price has reached the bearish mitigation block region on the daily chart, suggesting a corrective phase. These multiple confluences underscore the importance of comprehensive analysis for generating the best forex signals. The anticipated price correction targets 1.0600, offering valuable insights for discerning market trends and potential trading opportunities.
Trade on MT4 with Leverage up to 1:500! Trade on MT4 with Leverage up to 1:500!
X
We use cookies to ensure that we give you the best experience on our website. If you continue to use this site we will assume that you are happy with it.