NZDUSD Retests Bullish Trendline After Breakout

Azeez Mustapha

Updated:

Unlock Daily Forex Signals

Select a Plan

£39

1 - month
Subscription

Select

£89

3 - month
Subscription

Select

£129

6 - month
Subscription

Select

£399

Lifetime
Subscription

Select

£50

Separate Swing Trading Group

Select

Or

Get VIP forex signals, VIP crypto signals, swing signals, and forex course free for lifetime.

Just open an account with one our affiliate broker and make a minimum deposit: 250 USD.

Email [email protected] with a screenshot of funds on account to get access!

Sponsored by

Sponsored Sponsored
Checkmark

Service for copy trading. Our Algo automatically opens and closes trades.

Checkmark

The L2T Algo provides highly profitable signals with minimal risk.

Checkmark

24/7 cryptocurrency trading. While you sleep, we trade.

Checkmark

10 minute setup with substantial advantages. The manual is provided with the purchase.

Checkmark

79% Success rate. Our outcomes will excite you.

Checkmark

Up to 70 trades per month. There are more than 5 pairs available.

Checkmark

Monthly subscriptions begin at £58.


Market Analysis – August 8

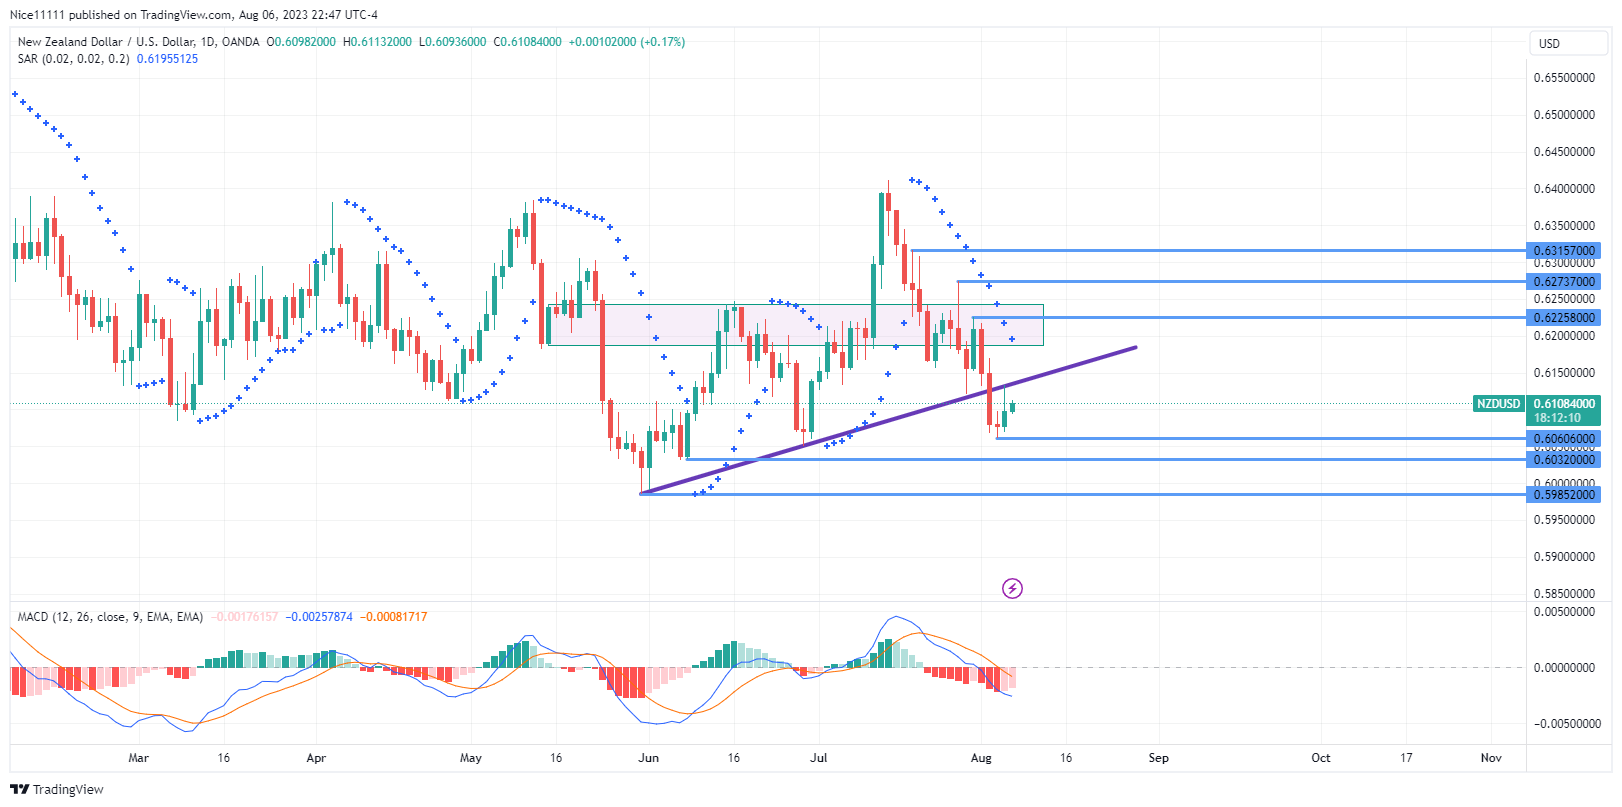
NZDUSD has broken the bullish trendline on the daily chart, signifying a significant development in the market dynamics. The price has consistently declined since the failed breakout above 0.6370, indicating a shift in the overall sentiment.

NZDUSD Key Levels

Demand Zones: 0.6060, 0.6030, 0.5980
Supply Zones: 0.6220, 0.6270, 0.6300

NZDUSD Retests Bullish Trendline After BreakoutNZDUSD Long-term Trend: Bearish

To confirm the bearish motion, the Parabolic SAR (Stop and Reverse) indicator currently rests above the daily candles on the chart, reinforcing the prevailing bearish outlook. Simultaneously, a pullback to the bullish trendline has been observed, potentially influencing the bearish order flow in the market.

The demand level of 0.6200 failed to hold, which adds further credibility to the bearish narrative. The MACD (Moving Averages Convergence and Divergence) indicator also aligns with the current bearish trend, solidifying the bearish sentiment.


NZDUSD Retests Bullish Trendline After Breakout
NZDUSD Short-term Trend: Bearish

On the 4 hours chart, a retest of the trendline resulted in a significant bearish candle, indicating a potential continuation of the short-term bearish trajectory.

Notably, the four-hour chart’s MACD and Parabolic SAR indicators still exhibit bullish tendencies. Consequently, waiting for an alignment of the technical indicators on the lower timeframe would be prudent before seeking an optimum entry point. The 0.6060 level appears to be the next short-term bearish target.

Do you want to take your trading to the next level? Join the best platform for that here 

  • Broker
  • Benefits
  • Min Deposit
  • Score
  • Visit Broker
  • Award-winning Cryptocurrency trading platform
  • $100 minimum deposit,
  • FCA & Cysec regulated
$100 Min Deposit
9.8
  • 20% welcome bonus of upto $10,000
  • Minimum deposit $100
  • Verify your account before the bonus is credited
$100 Min Deposit
9
  • Over 100 different financial products
  • Invest from as little as $10
  • Same-day withdrawal is possible
$250 Min Deposit
9.8
  • The Lowest Trading Costs
  • 50% Welcome Bonus
  • Award-winning 24 Hour Support
$50 Min Deposit
9
  • Fund Moneta Markets account with a minimum of $250
  • Opt in using the form to claim your 50% deposit bonus
$250 Min Deposit
9

Share with other traders!

Azeez Mustapha

Azeez Mustapha is a trading professional, currency analyst, signals strategist, and funds manager with over ten years of experience within the financial field. As a blogger and finance author, he helps investors understand complex financial concepts, improve their investing skills, and learn how to manage their money.

Leave a Reply

Your email address will not be published. Required fields are marked *