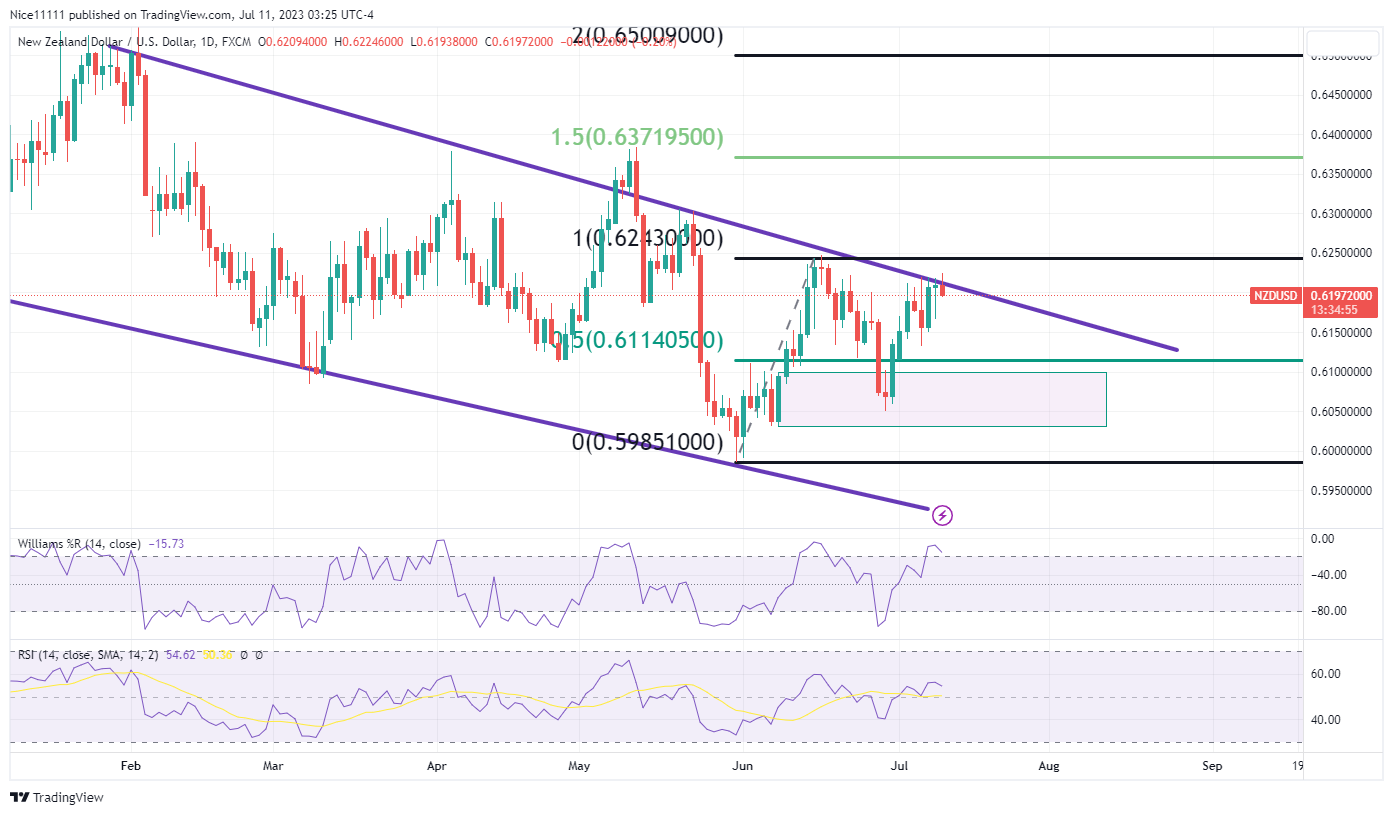
The NZDUSD currency pair has experienced a remarkable surge, soaring from its previous discount price observed during the last bullish swing, and it is now approaching the previous highs recorded on the daily chart.
Taking a closer look at the daily candles, it becomes evident that they have encountered the upper boundary of a parallel channel, which is currently acting as a formidable resistance level to the ongoing ascent. This resistance presents a significant challenge for the currency pair, as it attempts to surpass the previous highs and continue its upward trajectory.
Analyzing the technical indicators, the Relative Strength Index (RSI) reveals a bullish market sentiment, indicating that the buying pressure remains strong. However, caution is warranted as the Williams %R (Percent Range) indicator has already signaled that the price is overbought.
NZDUSD Short-term Trend: Bullish
Zooming in on the 4-hour chart, the market structure continues to exhibit a bullish bias, with no visible signs of a reversal. Traders are eagerly watching for any shifts in momentum or changes in the market structure that could confirm a potential reversal.
The critical factor to monitor is the break of the resistance trendline, as a decisive breach would serve as confirmation of a new bullish trend. On the other hand, if the price fails to breach the resistance and reverses, it could indicate a continuation of the bearish trend.
Trade on MT4 with Leverage up to 1:500! Trade on MT4 with Leverage up to 1:500!
X
We use cookies to ensure that we give you the best experience on our website. If you continue to use this site we will assume that you are happy with it.
 NZDUSD Short-term Trend: Bullish
 NZDUSD Short-term Trend: Bullish


