

Market Analysis – July 4
The NZDUSD currency pair has been exhibiting a pattern of lower highs and higher lows, forming a symmetrical triangle on the price chart. This consolidation pattern suggests that the market is undergoing a period of indecision and is preparing for a potential breakout.
NZDUSD Key Levels
Demand Levels: 0.6100, 0.5900, 0.5800
Supply Levels: 0.6250, 0.6400, 0.6500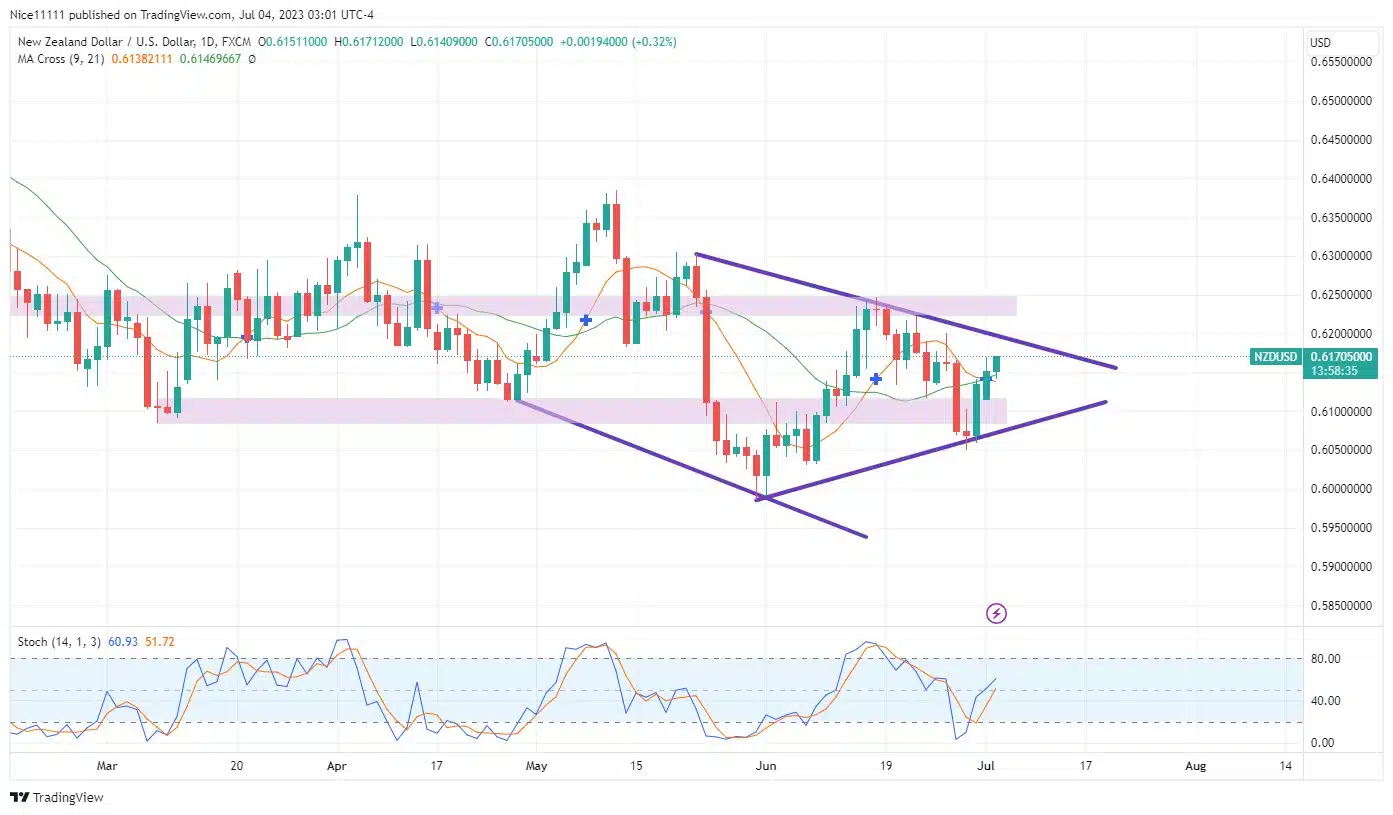
NZDUSD Long-term Trend: Ranging
Recently, long orders for NZDUSD were strategically placed, taking advantage of the liquidity resting below the swing lows of around 0.6100. The Stochastic indicator proved valuable in identifying a false bearish breakout, signalling that the price had already become oversold. As a result, once sell stops were triggered, the price rallied and reached the resistance level at 0.6250.
However, the ascent of the price was hindered as it encountered a test of the bullish order block near 0.6250. The Stochastic indicator indicated that the price had become overbought within this zone. Additionally, the Moving Averages crossed sideways, indicating the market’s indecisiveness and lack of a clear trend. Traders and investors are now awaiting an impulsive expansion in price to determine the intentions and actions of large market participants, often referred to as “whales.”
NZDUSD Short-term Trend: Bullish
Overall, the current price action of NZDUSD within the symmetrical triangle suggests that the market is poised for a significant move. Traders should closely monitor the breakout direction for potential trading opportunities.
Do you want to take your trading to the next level? Join the best platform for that here


