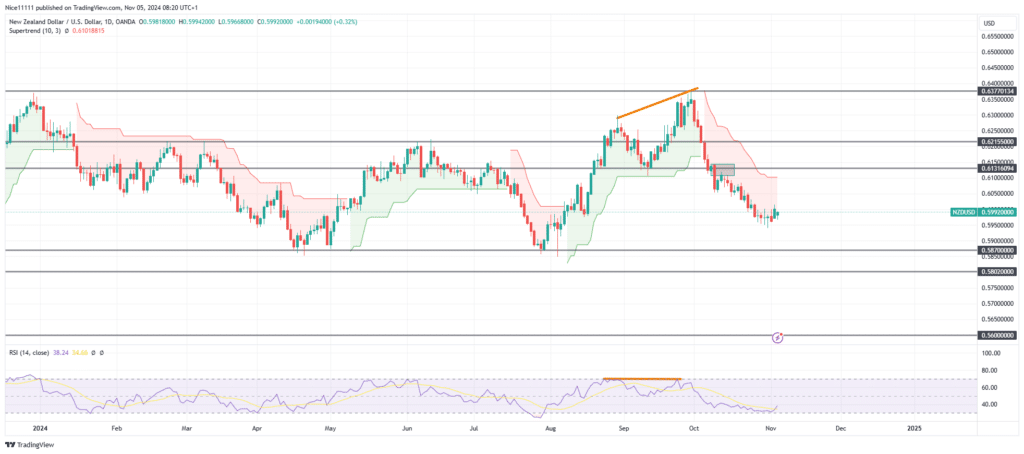
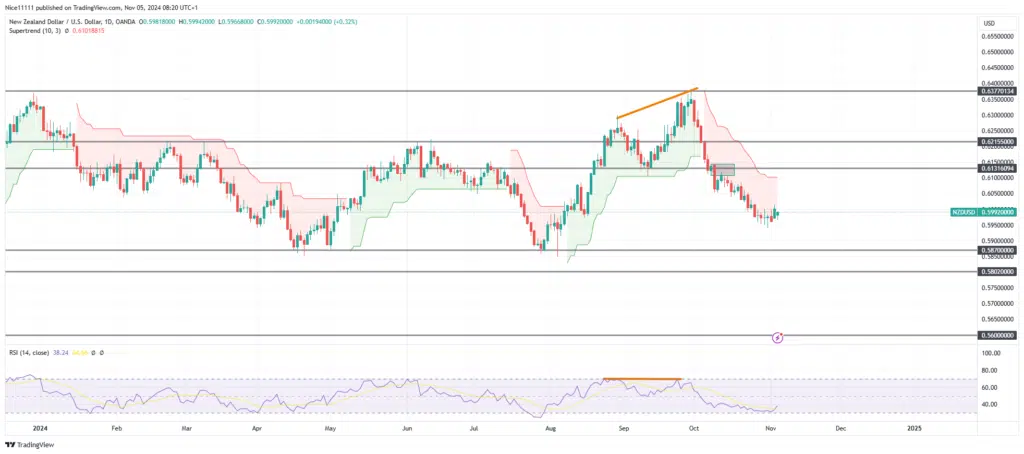
NZDUSD has been in a firm downtrend since late September, where a shooting star formed in the supply zone around 0.63770, indicating a potential reversal. This triggered a strong bearish movement, accompanied by high selling momentum, which has gradually weakened in recent sessions.
NZDUSD Key Levels
Demand Levels: 0.58700, 0.58020, 0.56000
Supply Levels: 0.61320, 0.62160, 0.63770
NZDUSD Long-term Trend: Bearish
In September, NZDUSD rose to a new high in the supply zone of 0.63770. However, the RSI (Relative Strength Index) showed an equal high, creating a bearish divergence that revealed underlying weakness in the market. Soon after, the pattern of “three black crows” appeared, with three consecutive long bearish candlesticks signalling intensified selling pressure.
The downtrend strengthened in October as NZDUSD broke through the key level of 0.61320. Following this break, a retest of the bearish order block at that level attracted an influx of sell orders, which further intensified the bearish outlook. Yet, with RSI now approaching the oversold region and smaller candles forming on the daily chart, bearish momentum appears to be losing steam.
NZDUSD Short-term Trend: Ranging
On the 4-hour chart, NZDUSD has entered a range, with sideways movement reflecting a decrease in bearish momentum. This shift suggests that the market may lack the strength for further significant declines in the short term. As risk management becomes increasingly important, traders may want to consider partial exits from bearish positions sourced from forex signals. Maintaining flexible strategies is key in navigating potential reversals with waning selling pressure.
Trade on MT4 with Leverage up to 1:500! Trade on MT4 with Leverage up to 1:500!
X
We use cookies to ensure that we give you the best experience on our website. If you continue to use this site we will assume that you are happy with it.