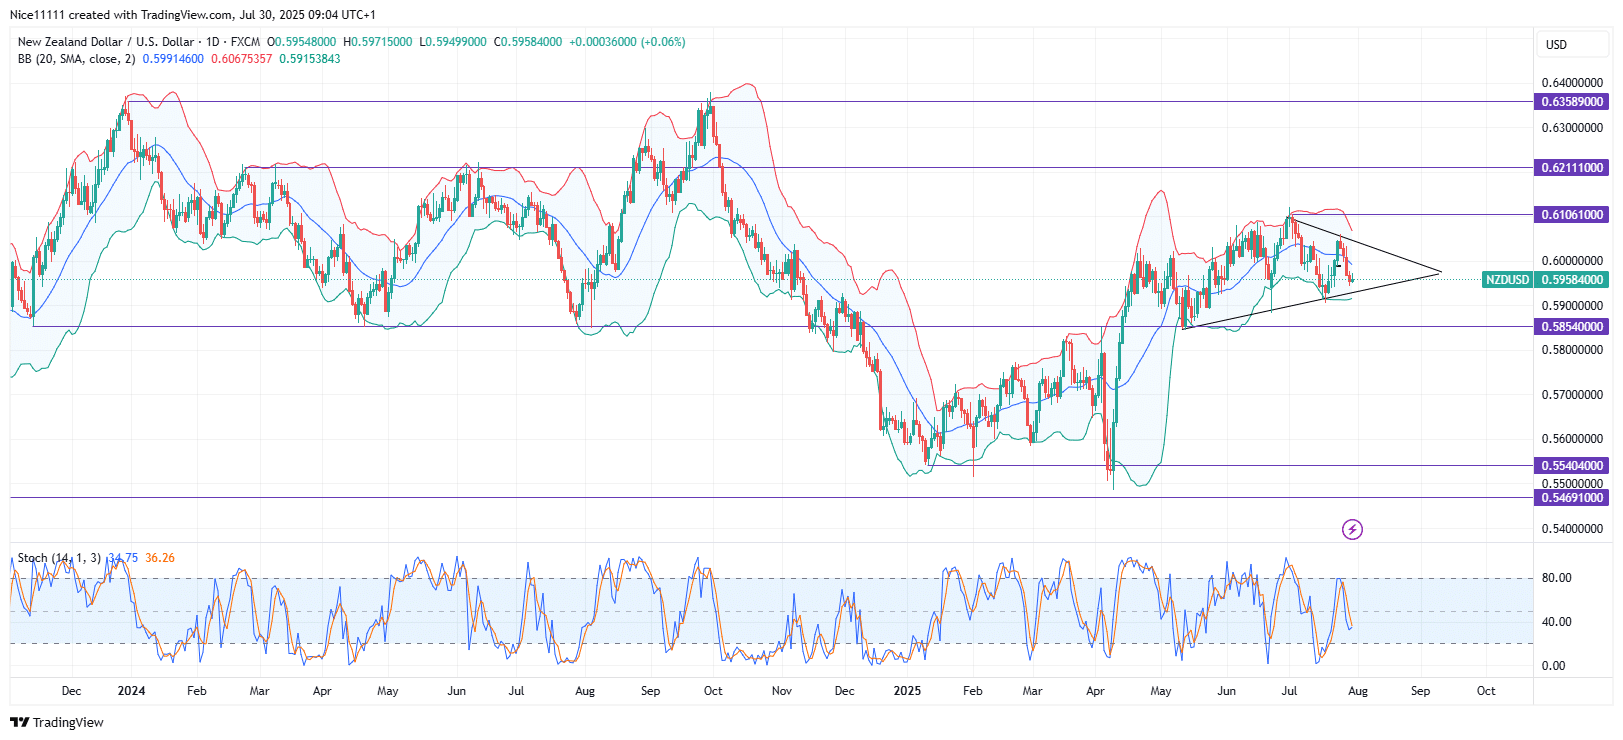
NZDUSD is currently undergoing a correction phase. The bullish reversal began with a sharp impulsive movement that surged above the key level of 0.58540. However, following this rapid upward displacement, the market has transitioned into a corrective phase, reflecting a shift in momentum.
Last year, NZDUSD concluded with a pronounced bearish trend. The price declined sharply, finding strong support at the 0.55400 demand level. From that point, the market began to consolidate. A new cycle of impulsive and corrective movement was initiated in April when the price rallied and broke through the 0.58540 resistance.
However, the impulsive rally was short-lived. Within the same month, a double top formation emerged, effectively halting the bullish momentum. Since then, the market has remained in a tight range. Price action continues to oscillate within the boundaries of the Bollinger Bands, reinforcing the consolidation.
NZDUSD Short-term Trend: Ranging
On the daily chart, a pennant pattern has developed, signaling indecision in the short term. Inside the pennant, the 4-hour chart reveals brief directional bursts. Currently, the price is approaching the support trendline of the pennant structure. Additionally, the Stochastic indicator on the 4-hour timeframe is already in the oversold region.
A breakout—either impulsively above the 0.61060 resistance or below the 0.58500 support—will provide clearer direction for NZDUSD’s next major move to generate accurate forex signals.
Trade on MT4 with Leverage up to 1:500! Trade on MT4 with Leverage up to 1:500!
X
We use cookies to ensure that we give you the best experience on our website. If you continue to use this site we will assume that you are happy with it.

 NZDUSD Short-term Trend: Ranging
 NZDUSD Short-term Trend: Ranging


