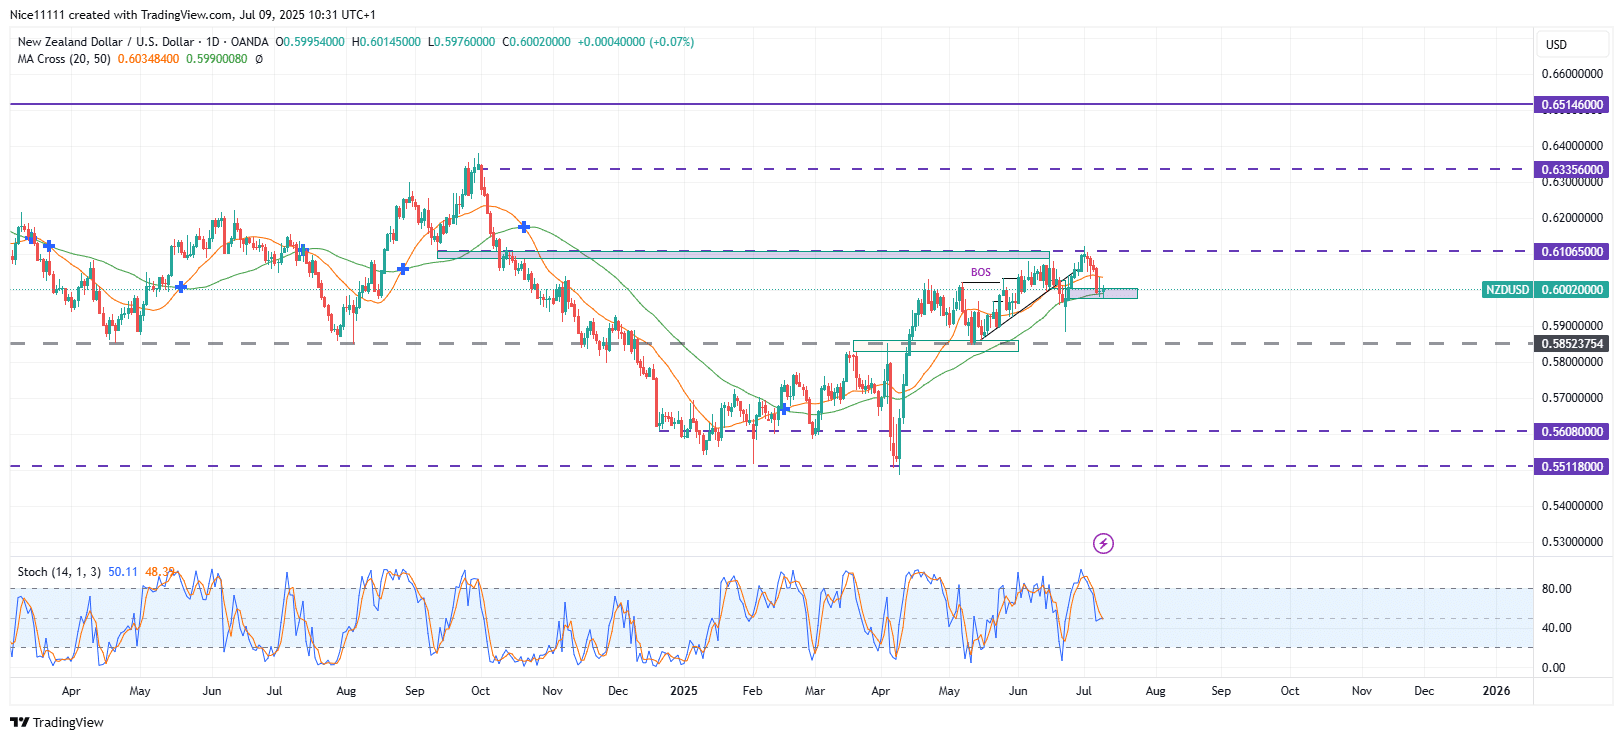
The NZDUSD pair shows signs of potential reversal after failing to break through the critical 0.61070 resistance level twice, forming a clear double-top pattern. The pair’s sluggish upward momentum has stalled, with technical indicators now pointing to increasing bearish pressure.
NZDUSD Key Levels to Watch
Support Levels: 0.58520, 0.58080, 0.55120 Resistance Levels: 0.61070, 0.63360, 0.65150
NZDUSD Long-Term Trend: Bullish
NZDUSD initially rebounded from the 0.58520 support level in May, but the bullish continuation lacked strong momentum. Price action has been marked by tight, congested candles on the daily chart, signalling weakening upward energy.
Despite two attempts to breach 0.61070, the pair faced strong rejection, confirming the presence of resistance. The Stochastic oscillator indicated overbought conditions at this level, reinforcing the risk of reversal. The subsequent decline has pushed the price into a fair value gap (FVG), which could offer temporary support. However, with NZD/USD now trading below the 20-period Moving Average and threatening to break the 50-period MA, downside risks are growing.
A decisive drop below 0.58860—followed by a close under 0.58520—would confirm a bearish trend reversal.
NZDUSD Short-Term Trend: Bearish
The 4-hour chart shows a bearish structure, though a bullish crossover suggests a possible short-term retracement. The fair value gap has temporarily slowed the decline, but traders should monitor lower timeframes for confirmation of whether the pair will stage a recovery or extend its downward move.
While the broader structure remains bullish, the double-top formation and weakening momentum suggest increasing downside potential. A break below 0.58520 could accelerate selling pressure.
Trade on MT4 with Leverage up to 1:500! Trade on MT4 with Leverage up to 1:500!
X
We use cookies to ensure that we give you the best experience on our website. If you continue to use this site we will assume that you are happy with it.

 NZDUSD Short-Term Trend: Bearish


