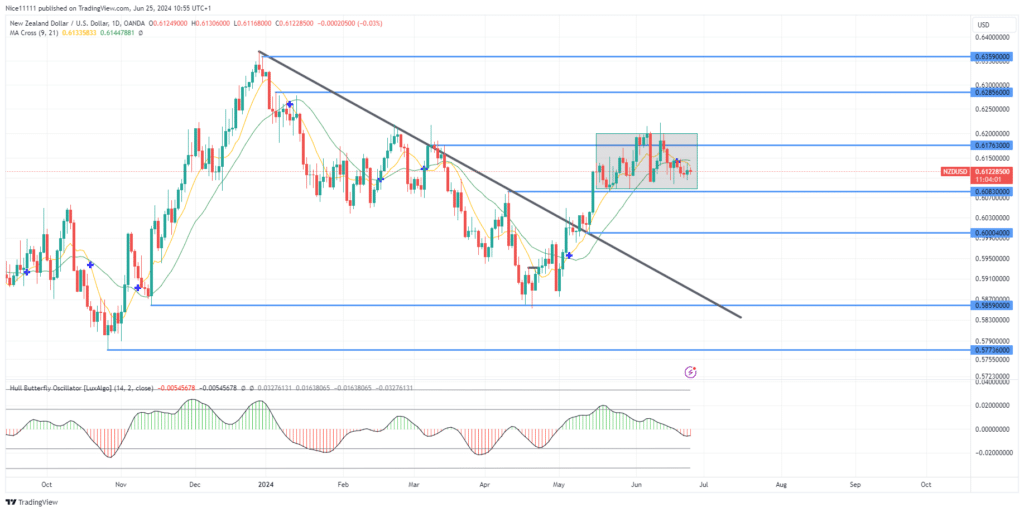
The NZDUSD market price is currently fluctuating within a range between a major resistance level and a demand level on the daily chart. This has resulted in the formation of a price range, indicative of a redistribution phase, even though the overall bullish market structure remains intact.
The NZDUSD market recently experienced a false breakout above 0.6180 due to a loss in bullish momentum. After briefly surpassing 0.6180, the price declined below this resistance zone and has struggled to rise again. However, the decline did not sweep the previous low, thereby sustaining the long-term bullish narrative.
The current support level was established from the test of the swing high formed in April during the previous downtrend. The Hull Butterfly Indicator has shown a significant decline in bullish momentum, further highlighting the redistribution phase.
NZDUSD Short-Term Trend: Ranging
The current redistribution phase is expected to be followed by a breakout. A significant push above 0.6180 is anticipated to resume the bullish trend. Conversely, a dip below 0.6000 could establish a bearish trend. The price action is currently choppy, suggesting that it may not be the safest environment for trading. Patience and careful observation of the market’s intentions are crucial to avoid potential losses.
You can purchase Lucky Block – Guide, Tips & Insights | Learn 2 Trade here. Buy LBLOCK
Note: Learn2.trade is not a financial advisor. Do your research before investing your funds in any financial asset or presented product or event. We are not responsible for your investing results.
Trade on MT4 with Leverage up to 1:500! Trade on MT4 with Leverage up to 1:500!
X
We use cookies to ensure that we give you the best experience on our website. If you continue to use this site we will assume that you are happy with it.

 NZDUSD Short-Term Trend: Ranging


