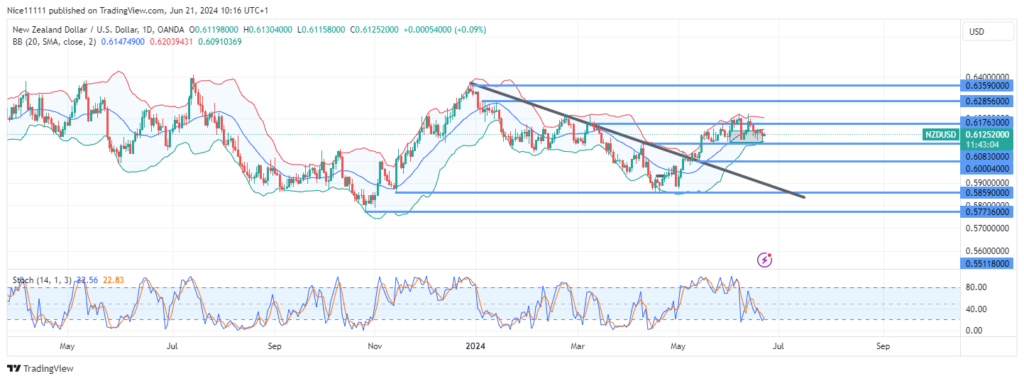
NZDUSD has struggled to break through the supply level of 0.6180. The bullish trend has transitioned into a consolidation phase, with the price oscillating between the resistance level of 0.6180 and the support zone of 0.6080.
NZDUSD Key Levels
Demand Levels: 0.6080, 0.6000, 0.5860
Supply Levels: 0.6180, 0.6290, 0.6360
NZDUSD Long-Term Trend: Bullish
The NZDUSD market turned bullish with the break of the resistance trendline in May. This shift in market structure was confirmed by the change in the Hull Butterfly Indicator’s colour, signalling rising momentum upon the breakout and leading to the price surpassing the previous resistance level of 0.6080.
However, the price has struggled to rise above 0.6180. Despite three attempts, buyers have yet to establish a successful breakout. The Hull Butterfly Indicator has shown falling momentum, with a decrease in the size of the green bars, and recently turning red, indicating weakness.
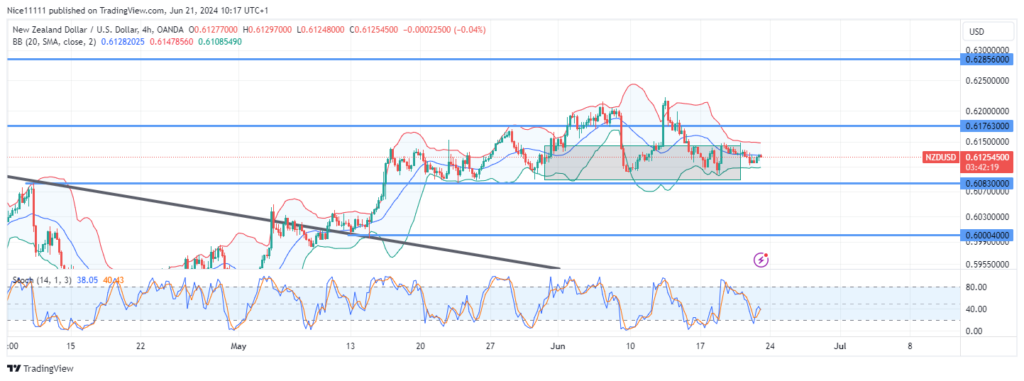
NZDUSD Short-Term Trend: Bearish
On the 4-hour chart, multiple relatively equal highs have formed, indicating a potential reversal. Despite this, the higher timeframe trend remains bullish until the demand level of 0.6080 is broken. It is crucial to wait for a breakout of the current range to establish safe forex signals for the next price movement.
You can purchase Lucky Block – Guide, Tips & Insights | Learn 2 Trade here. Buy LBLOCK
Note: Learn2.trade is not a financial advisor. Do your research before investing your funds in any financial asset or presented product or event. We are not responsible for your investing results.
Trade on MT4 with Leverage up to 1:500! Trade on MT4 with Leverage up to 1:500!
X
We use cookies to ensure that we give you the best experience on our website. If you continue to use this site we will assume that you are happy with it.