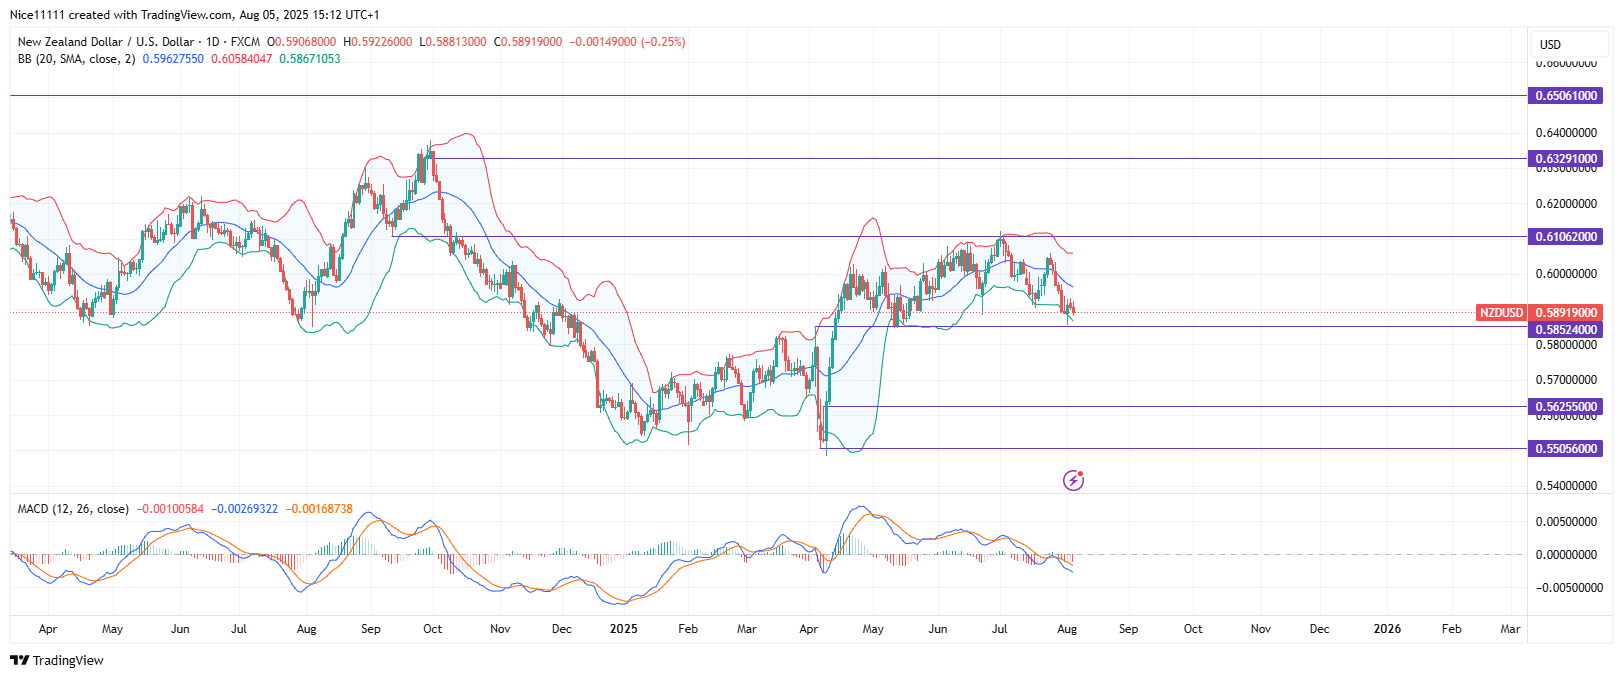
NZDUSD encountered a major roadblock at the 0.61060 level. Unfortunately, buyers had already lost the significant momentum that was initially used to drive the bullish reversal. Although there was an effort to sustain the bullish direction, buyers have struggled to maintain upward pressure, and the emergence of a Head and Shoulders pattern is now clearly revealing weakness in the current structure.
NZDUSD expended a large amount of energy to enforce a breakout following an earlier failed attempt. In April, multiple pockets of Fair Value Gaps (FVGs) highlighted how rapidly the price accelerated from the 0.55050 level until the breakout was finally achieved, confirming bullish intent.
After this aggressive move, NZDUSD moved sluggishly toward an unmitigated opposing breaker block at 0.61060. This level also aligned with a test of the upper Bollinger Bands, indicating an overbought condition in the market. The consequence is now evident, as price has formed a Head and Shoulders pattern, which typically signals a potential reversal or weakening of bullish pressure.
NZDUSD Short-term Trend: Bearish
On the lower timeframe, the structure is bearish. Price is dropping sharply toward the key support level of 0.58520 on the 4-hour chart. A successful retest of this support zone may provide buyers with the opportunity to regain bullish momentum and mount another attempt to retest the 0.61060 resistance level. However, until such recovery is seen, the short-term trend remains in favor of sellers.
Trade on MT4 with Leverage up to 1:500! Trade on MT4 with Leverage up to 1:500!
X
We use cookies to ensure that we give you the best experience on our website. If you continue to use this site we will assume that you are happy with it.

 NZDUSD Short-term Trend: Bearish


