NZDUSD has encountered temporary support at the 0.58530 level, where price action has shown signs of consolidation. Following a retest of this zone, a double top pattern has emerged, signalling the possibility of renewed bearish momentum. This pattern, suggests that sellers may regain control, pushing the price further downwards if the support level fails to hold.
NZDUSD Key Levels
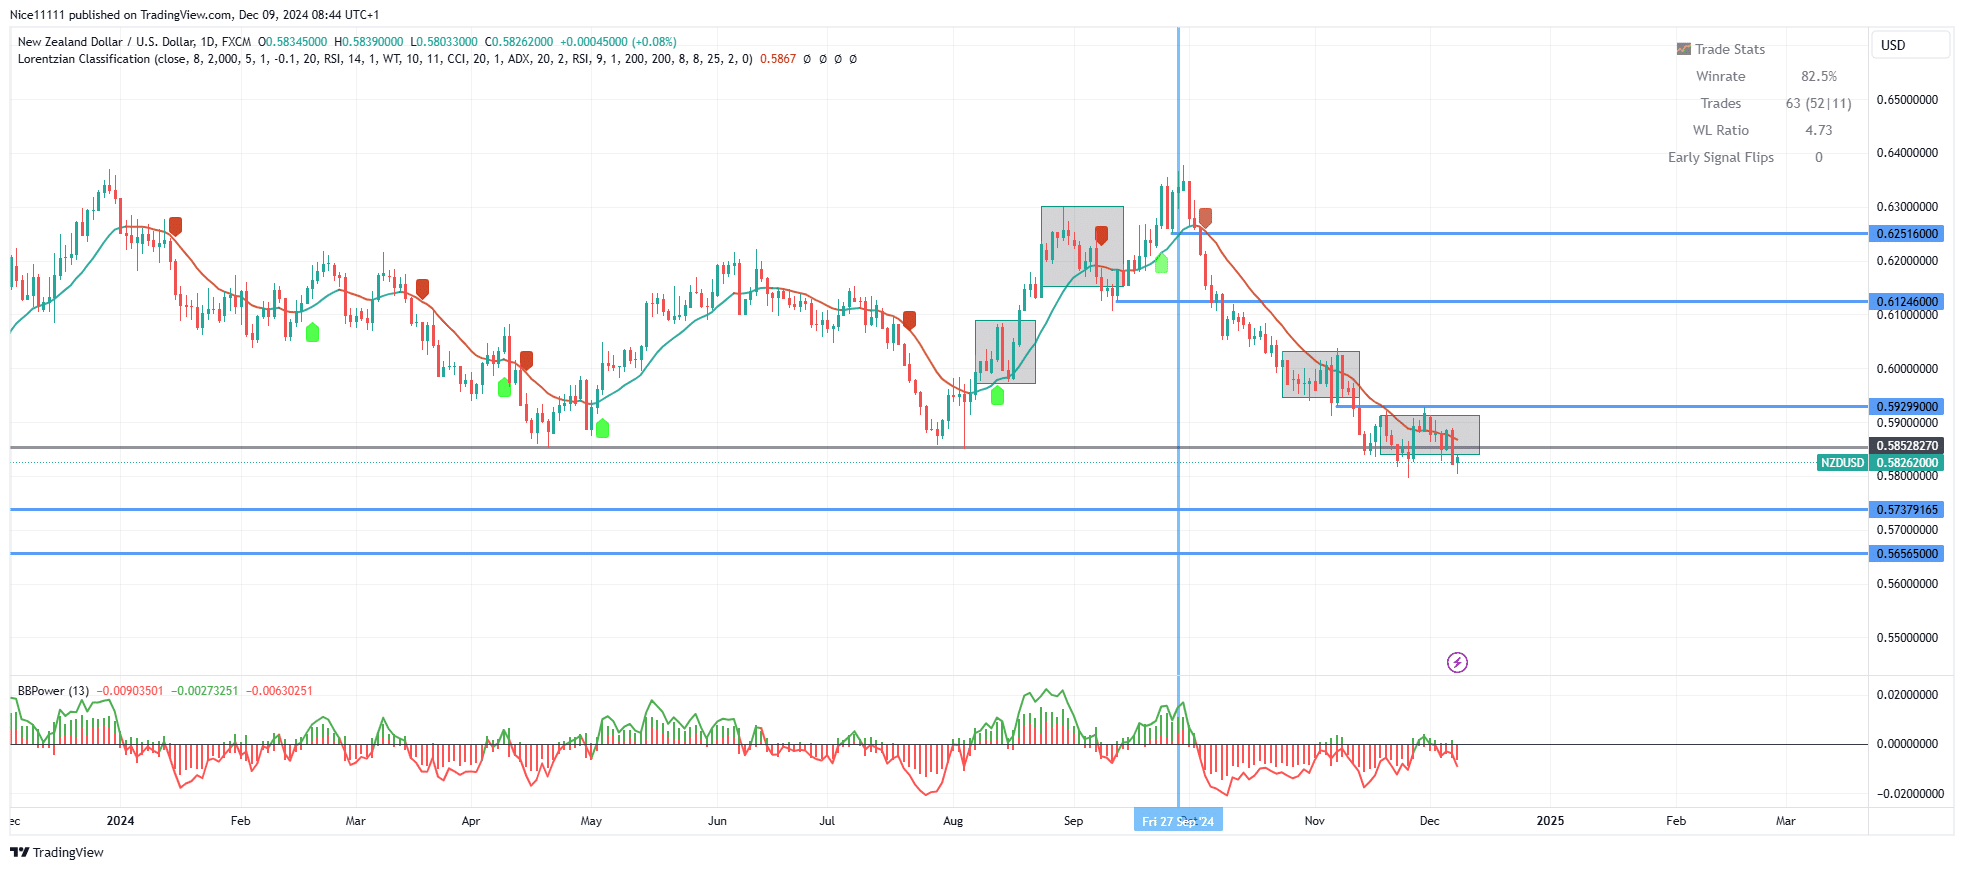
Demand Levels: 0.58530, 0.57380, 0.56570
Supply Levels: 0.59300, 0.61250, 0.62520
NZDUSD Long-Term Trend: Bearish
The market is undergoing its second major accumulation phase within the ongoing bearish trend. At the end of September, the Machine Learning Lorentizan Classification indicator flagged a red tag, indicating a directional shift towards a bearish outlook. This was followed by the Three Black Crows pattern, which decisively broke the 0.61250 demand level.
The breach of this level confirmed seller dominance, as highlighted by the Elder Ray Bull and Bear Power indicator. The price subsequently plunged, reaching the 0.58530 demand level. The double-top pattern formation at this level suggests further downside momentum may be forthcoming.
NZDUSD Short-Term Trend: Bearish
In the lower timeframes, a bearish structure remains dominant. The price has dipped below the 0.58530 key level, where a bearish order block resides. This zone provides an ideal entry point for forex signals short positions, targeting the next support level near 0.57380.
Trade on MT4 with Leverage up to 1:500! Trade on MT4 with Leverage up to 1:500!
X
We use cookies to ensure that we give you the best experience on our website. If you continue to use this site we will assume that you are happy with it.

 NZDUSD Short-Term Trend: Bearish
 NZDUSD Short-Term Trend: Bearish


