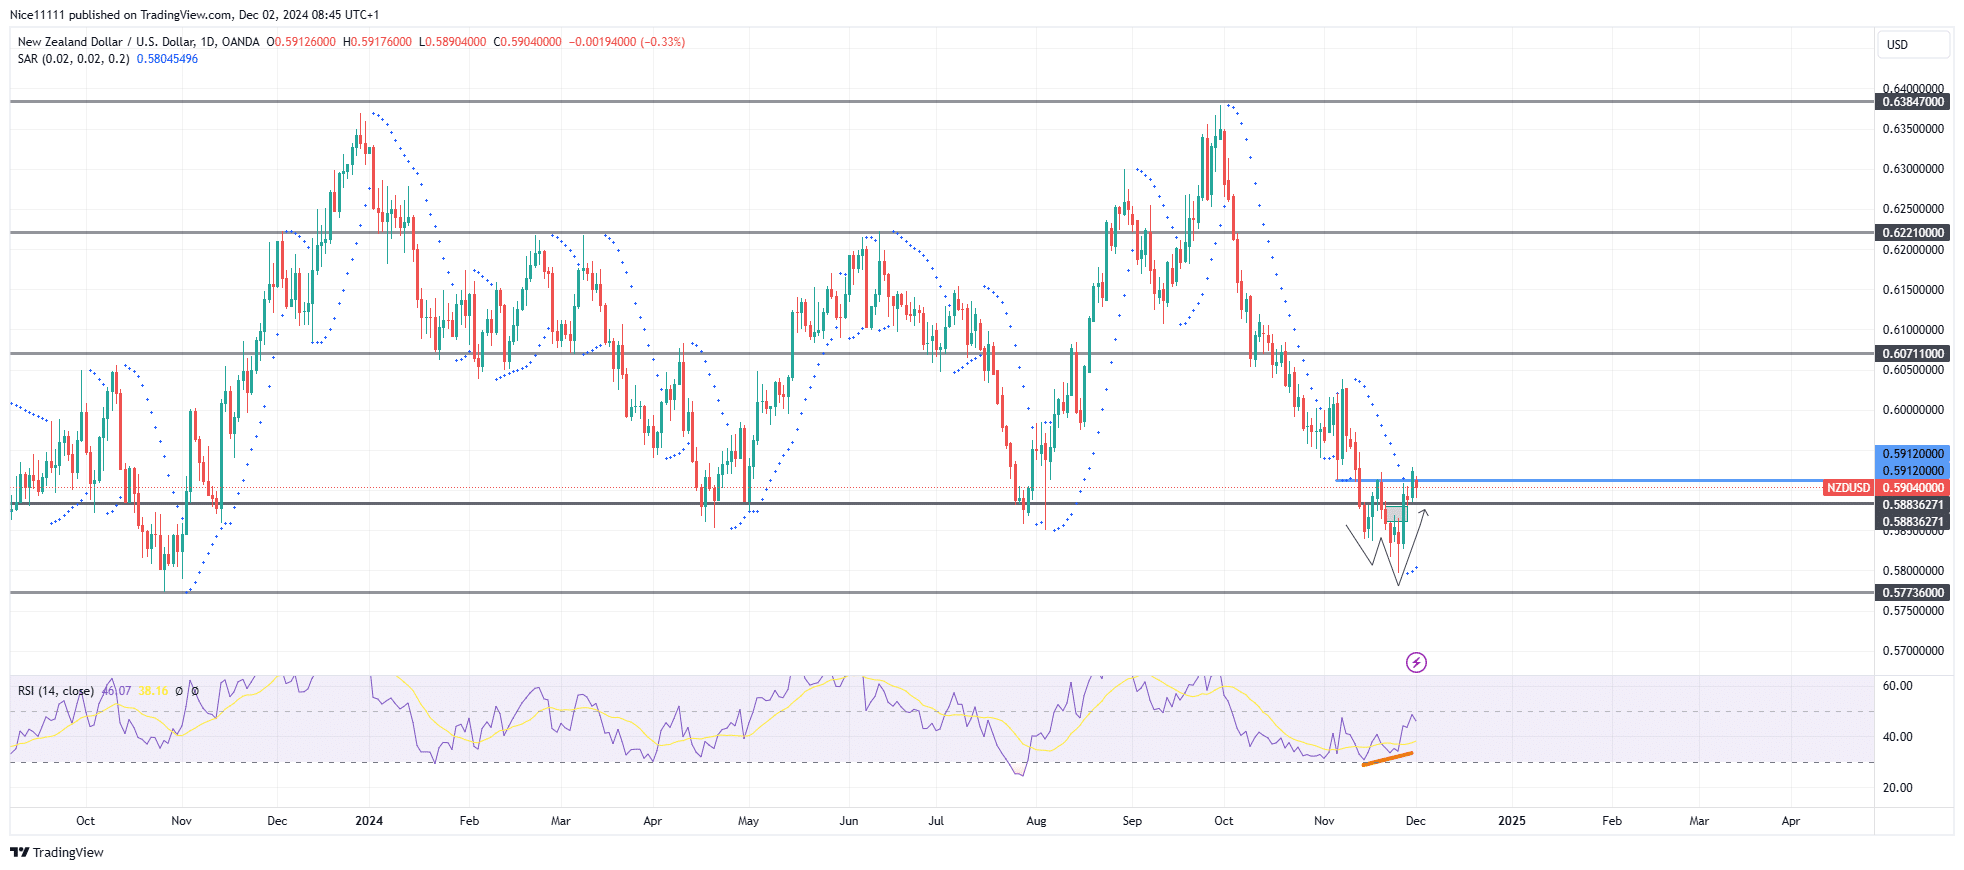
NZDUSD has swept major lows at 0.58840, a critical level that holds significant liquidity. This move may have been a deliberate action by market participants to accumulate orders for a potential reversal. Subsequently, a double bottom pattern has emerged at this zone, often viewed as a classic reversal signal, hinting at a potential shift in market control from bears to bulls.
The sustained decline below the demand zone at 0.58840 pushed the market into oversold territory, as indicated by the Relative Strength Index (RSI). This zone, characterized by relative equal lows, signifies a strong liquidity pocket, which could facilitate a bullish reversal.
The RSI bullish divergence at the double bottom further supports the possibility of a reversal. Additionally, the Parabolic SAR (Stop and Reverse) has begun plotting below price levels, signaling early signs of upward momentum.
NZDUSD Short-Term Trend: Bullish
On lower timeframes, the market has already begun forming a bullish trend, confirmed by a single break of structure to the upside. However, a second break of structure would provide stronger confirmation of the trend reversal. Patience is advised until this occurs, ensuring a higher probability of success for long positions.
While NZDUSD has shown promising reversal signs, traders should closely monitor price action for further validation of bullish intent. A sustained move above 0.58840 could signify the start of a broader bullish trend.
Trade on MT4 with Leverage up to 1:500! Trade on MT4 with Leverage up to 1:500!
X
We use cookies to ensure that we give you the best experience on our website. If you continue to use this site we will assume that you are happy with it.

 NZDUSD Short-Term Trend: Bullish
 NZDUSD Short-Term Trend: Bullish


