

Market Analysis —November 26
The NZDUSD pair has decisively broken through the critical support level at 0.58840, a zone that historically held as a demand region for over a year. This level endured multiple tests in November, April, and August, but persistent bearish pressure has finally resulted in a breakdown.
NZDUSD Key Levels
- Demand Levels: 0.57740, 0.56100, 0.55000
- Supply Levels: 0.58840, 0.62210, 0.63850
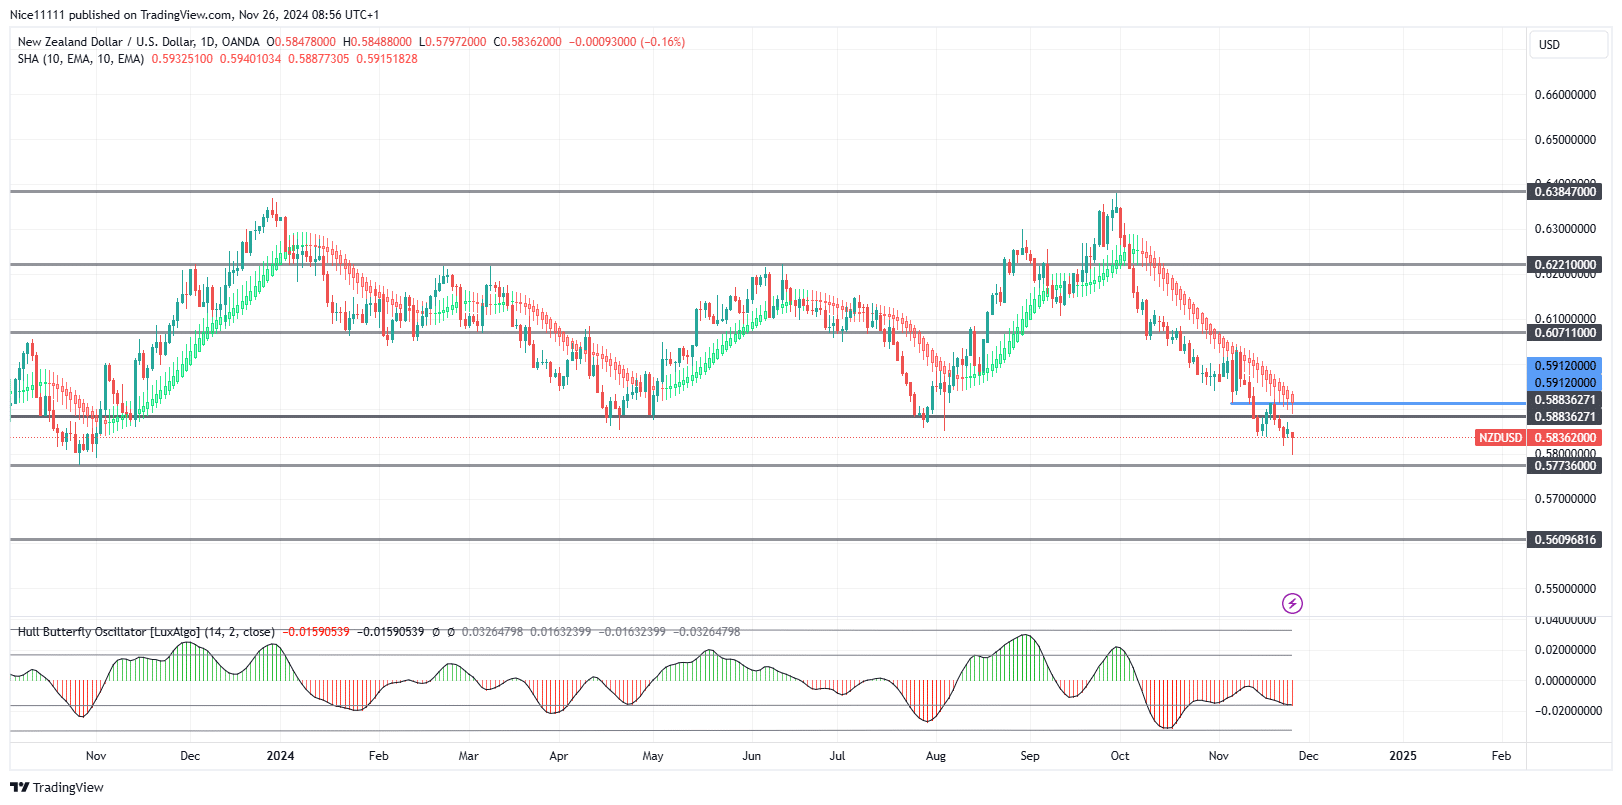

On the bearish trend, the price corrected towards the key level of 0.60710 after a breakout. This temporary ascent retested the Smoothed Heikin Ashi candles, which resisted the ascent and paved the way for the downward trend to resume.
The pullback to a bearish order block of 0.60710 provided additional fuel for the breakout below 0.58840. The Hull Butterfly Oscillator further validates the trend, highlighting the dominance of bearish forces in the market.
 NZDUSD Short-Term Trend: Bearish
The recent breakout below 0.58840 was followed by a retest at 0.59120, aligning with a bearish mitigation block. This pullback offered an ideal entry point for traders utilizing forex signals in sync with the prevailing trend.
Currently, the price is descending toward the next demand zone at 0.57740, signaling continued bearish momentum in the short term.
Do you want to take your trading to the next level? Join the best platform for that here


