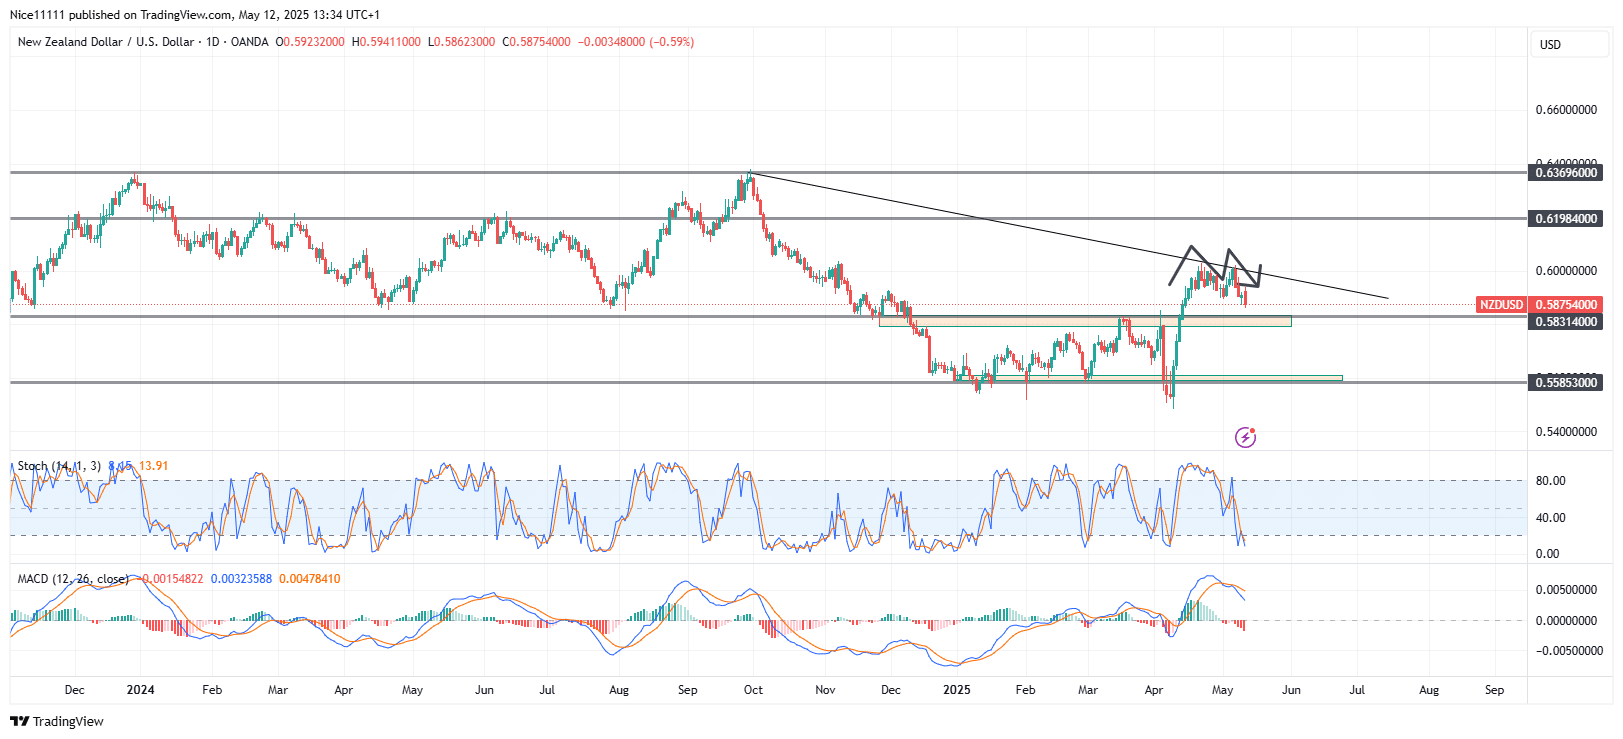
The NZDUSD pair has seen consistent buyer defence at the 0.55850 demand level throughout the year. Following the latest retest, a sharp bullish displacement occurred, but the market has now formed a double top pattern, signaling potential weakness.
NZDUSD Key Levels
Demand Zones: 0.5830, 0.5590, 0.5400
Supply Zones: 0.6000, 0.6200, 0.6370
NZDUSD Long-Term Trend: Bullish
The 0.5830 level has been pivotal in NZDUSD price action, acting as support from December 2023 to December 2024. After a temporary breakdown, it transitioned into resistance, leading to a prolonged consolidation phase until April 2024. The recent bullish breakout above this level suggests a potential role reversal, with 0.5830 now acting as new support.
The strong upward surge in April created a market inefficiency zone, but upon reaching the psychological 0.6000 barrier, a double top pattern emerged, indicating a possible pullback. The bearish crossover on the MACD further supports the likelihood of a deeper retracement.
NZDUSD Short-Term Trend: Bullish
On the 4-hour chart, a bearish shift in market structure is evident. Buyers may seek support near 0.5830 if the pullback extends to regain momentum lost during the breakout phase. A hold above this level could reinforce the bullish trend, while a breakdown may lead to a test of lower demand zones.
Trade on MT4 with Leverage up to 1:500! Trade on MT4 with Leverage up to 1:500!
X
We use cookies to ensure that we give you the best experience on our website. If you continue to use this site we will assume that you are happy with it.

 NZDUSD Short-Term Trend: Bullish
 NZDUSD Short-Term Trend: Bullish


