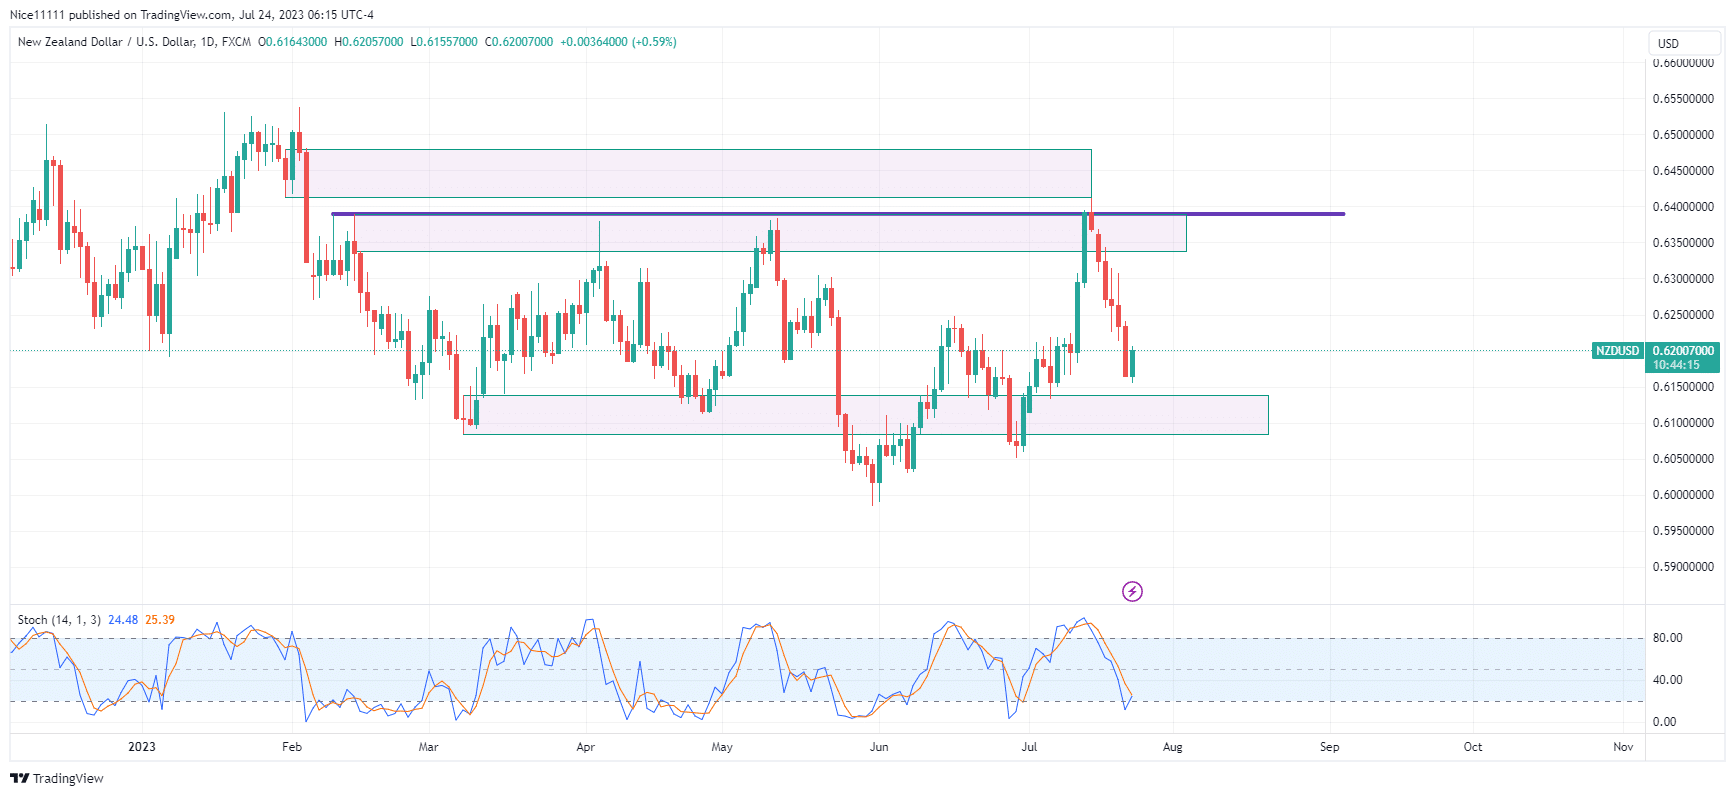
The NZDUSD price has been confined within a well-defined range, oscillating between the resistance level at 0.6400 and the support level at 0.6100. During this period, the Stochastic indicator has proven to be an effective tool, providing valuable signals of price extremes and potential reversals as the market approaches the boundaries of the range.
Key Levels for NZDUSD:
Demand Levels: 0.6150, 0.6050, 0.6000
Supply Levels: 0.6350, 0.6450, 0.6500
NZDUSD Long-term Trend: Ranging
In July, a notable rally occurred as the Stochastic signalled an oversold market, prompting a reversal and driving the price towards the resistance level. However, a false breakout above the previous relative equal highs at the resistance level ensued due to the test of a bearish order block positioned above the range.
NZDUSD Short-term Trend: Bearish
At present, the Stochastic is entering the oversold territory on the daily chart, suggesting a potential downturn. On the 4-hour timeframe, the price is significantly oversold according to the Stochastic indicator, further supporting the likelihood of a bearish move towards the lower boundary of the range. However, a bullish reversal is anticipated once the price reaches the support zones.
Trade on MT4 with Leverage up to 1:500! Trade on MT4 with Leverage up to 1:500!
X
We use cookies to ensure that we give you the best experience on our website. If you continue to use this site we will assume that you are happy with it.

 NZDUSD Short-term Trend: Bearish


