Market Analysis – April 24
NZDUSD has recently witnessed a bearish break of structure, providing a clearer direction for the market. The price is now driving toward the next support level.
NZDUSD Key Levels
Demand Levels: 0.6090, 0.5880, 0.5770
Supply Levels: 0.6350, 0.6500, 0.6600
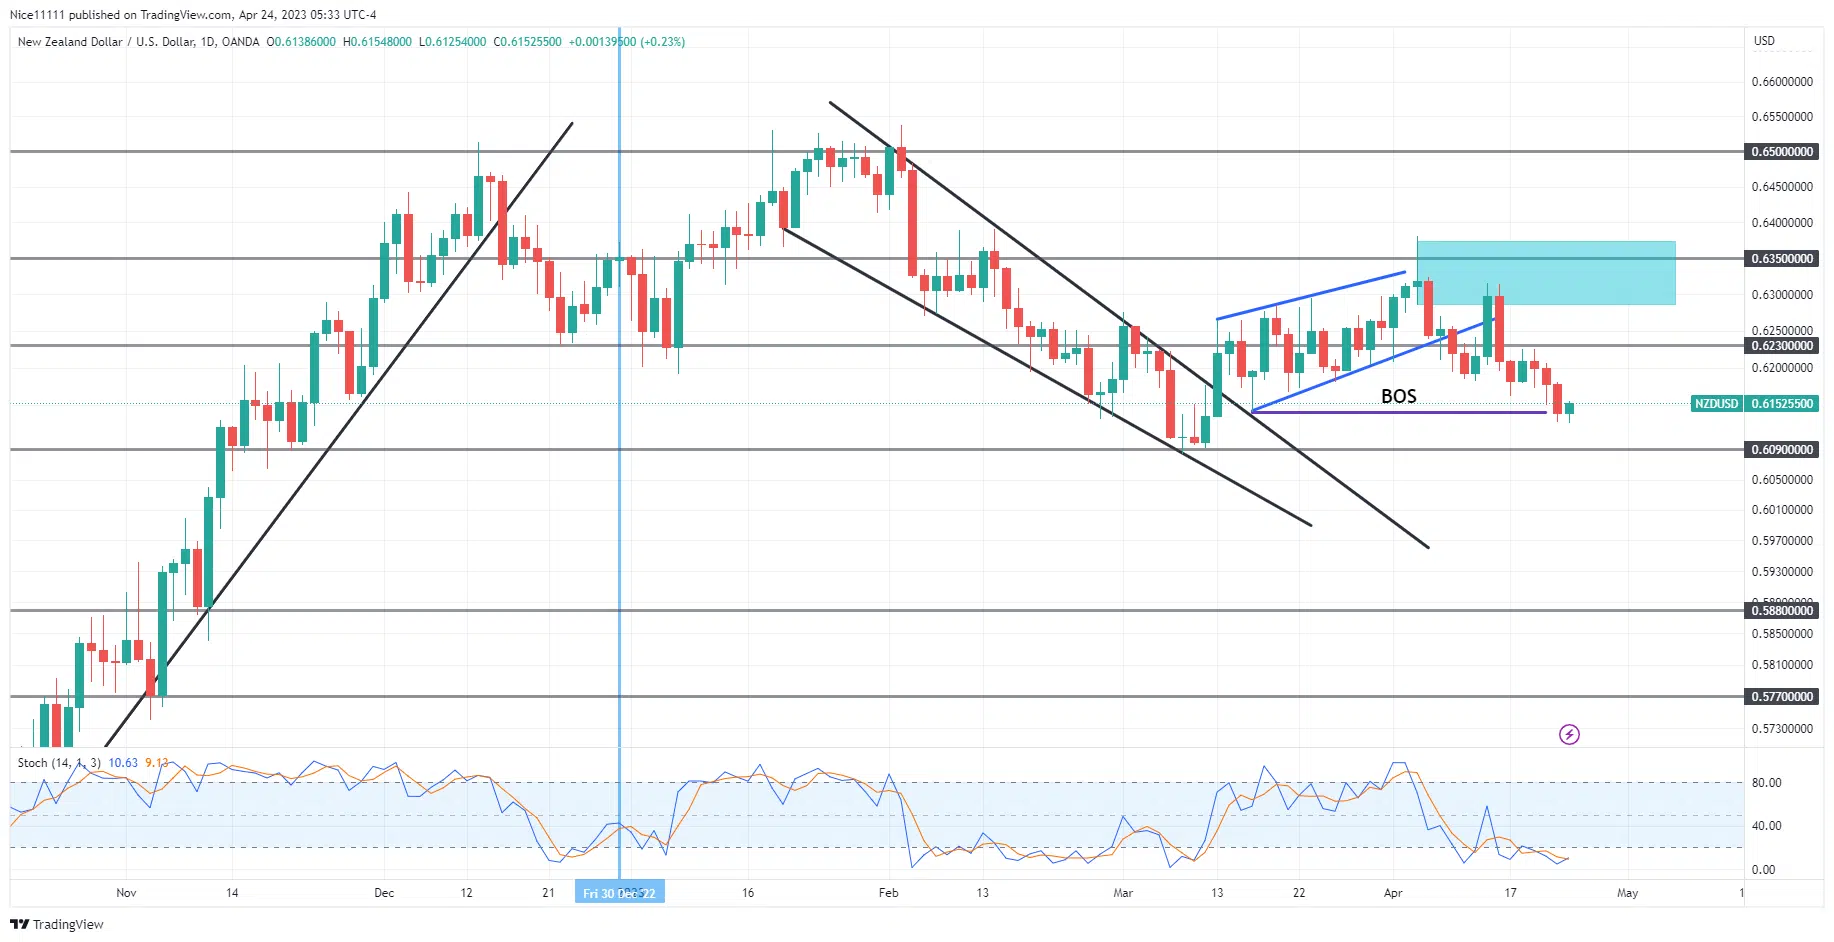
NZDUSD Long-term Trend: Bearish
NZDUSD experienced a selloff from the resistance level of 0.6500 down to the support level of 0.6090. The Stochastic indicator revealed oversold conditions when the support level was tested. Buyers then gained enough momentum to break the descending wedge pattern on the daily timeframe, creating a bullish market structure.
The price reached new highs until it tested the supply level of 0.6350. However, the rejection of the price at the resistance level was evident with the formation of a pin bar. This led to a shift in market structure as the price dropped from overbought conditions, according to the Stochastic indicator.

NZDUSD Short-term Trend: Bearish
The recent pullback to the institutional candle of 0.6350 above the fair value gap has attracted selling pressure from bears. A new bearish break of structure has occurred on both the daily and 4-hour charts, indicating a short-term bearish trend. The price is expected to continue its downward momentum toward the next support level of 0.6090.
Do you want to take your trading to the next level? Join the best platform for that here
- Broker
- Min Deposit
- Score
- Visit Broker

- Award-winning Cryptocurrency trading platform
- $100 minimum deposit,
- FCA & Cysec regulated
9.8

- 20% welcome bonus of upto $10,000
- Minimum deposit $100
- Verify your account before the bonus is credited
9
- Fund Moneta Markets account with a minimum of $250
- Opt in using the form to claim your 50% deposit bonus
9
Learn to Trade
Never Miss A Trade Again

step 1
Signal Notification
Real-time signal notifications whenever a signal is opened, closes or Updated

step 2
Get Alerts
Immediate alerts to your email and mobile phone.

step 3
Entry Price Levels
Entry price level for every signal Just choose one of our Top Brokers in the list above to get all this free.