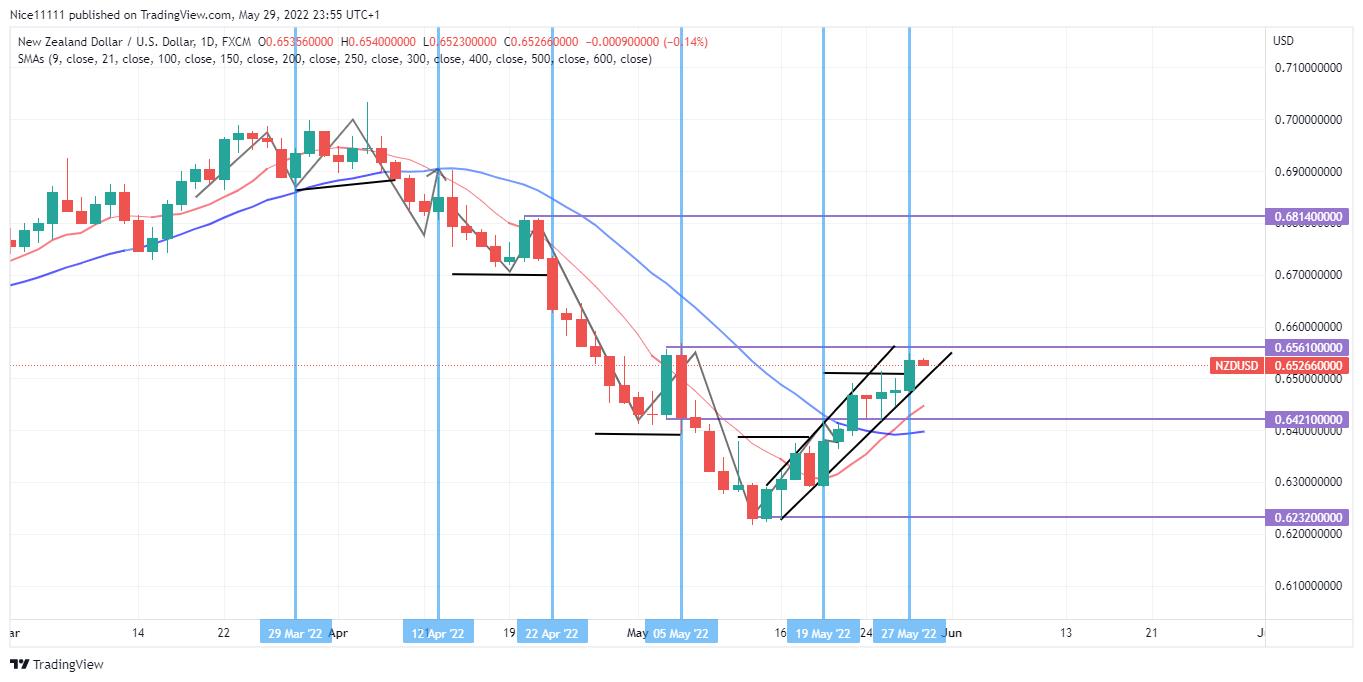
NZDUSD experiences a bullish structural shift in the market. On the 29th of March, the daily low was dashed by the daily bearish candle on the 8th of April 2022. This caused a structural shift in the bullish structure. On the 8th of April, the bearish candles dipped past the neckline, which was formed on the double top reversal pattern.
NZDUSD Key Zones
Resistance Zones: 0.68140, 0.65610 Support Zones: 0.62320, 0.64210
NZDUSD Long Term Trend: Bullish
The daily low of March 29th, which formed the neckline of the double top, was retested on April 12th. The retest of the neckline is evident with a daily bullish candle. This increased the selling pressure in the market. There was a break of structure below the resistance level at 0.68140.
On the 22nd of April, the most recent low formed on the 18th of April was invalidated. The trend continued to descend after the bearish structural shift in the market. A new break of structure occurred on the 5th of May to continue the bearish trend. The low formed below the indecision candlestick on the 3rd of May was swept.
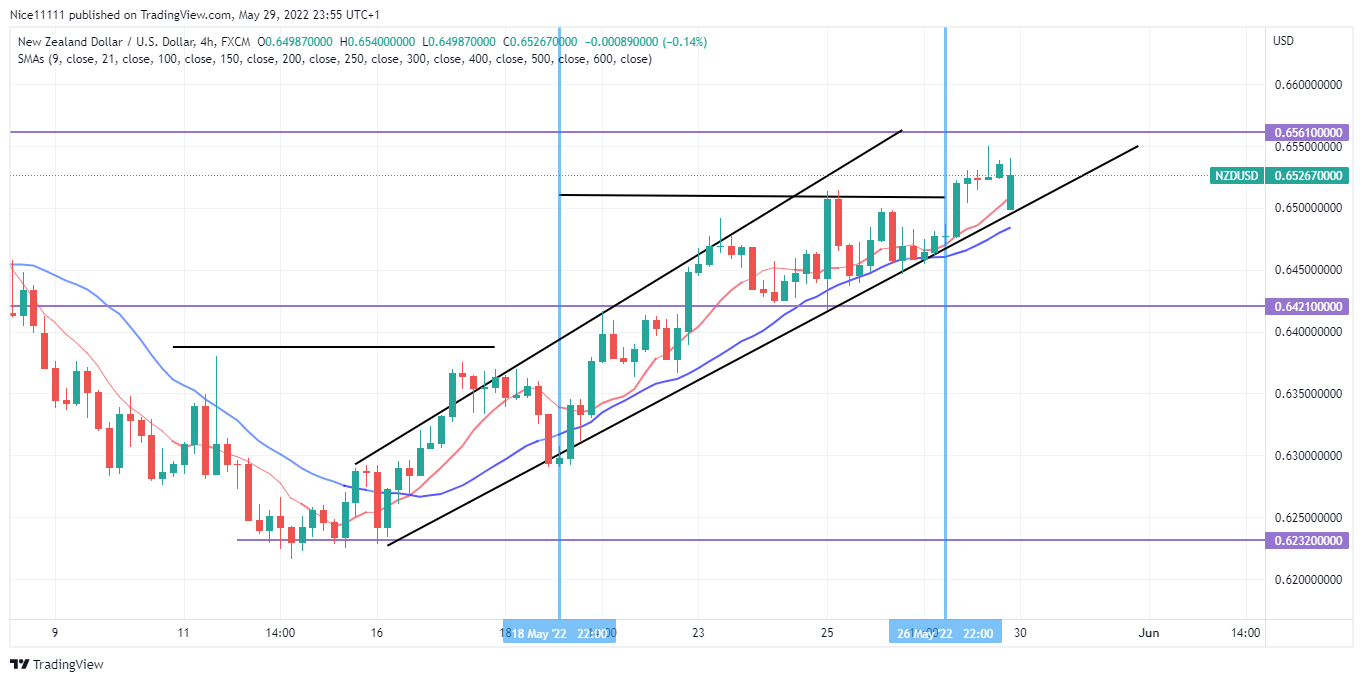
NZDUSD Long Term Trend: Bullish
The market reached the demand zone at $0.62320 on the 12th of May. The bulls took over immediately as the bullish candles took off from the support level. The four-hour timeframe is very bullish. The candles are rising through an expanding channel.
The bullish candle high on the 11th of May was dashed. This caused a bullish structural shift. The market appears to be in a trend reversal as the Moving Average period nine has crossed the Moving Average period twenty-one to the upside. The market is expected to reach the major zone of 0.65610 very soon.
Note:Learn2.trade is not a financial advisor. Do your research before investing your funds in any financial asset or presented product or event. We are not responsible for your investing results.
Trade on MT4 with Leverage up to 1:500! Trade on MT4 with Leverage up to 1:500!
X
We use cookies to ensure that we give you the best experience on our website. If you continue to use this site we will assume that you are happy with it.