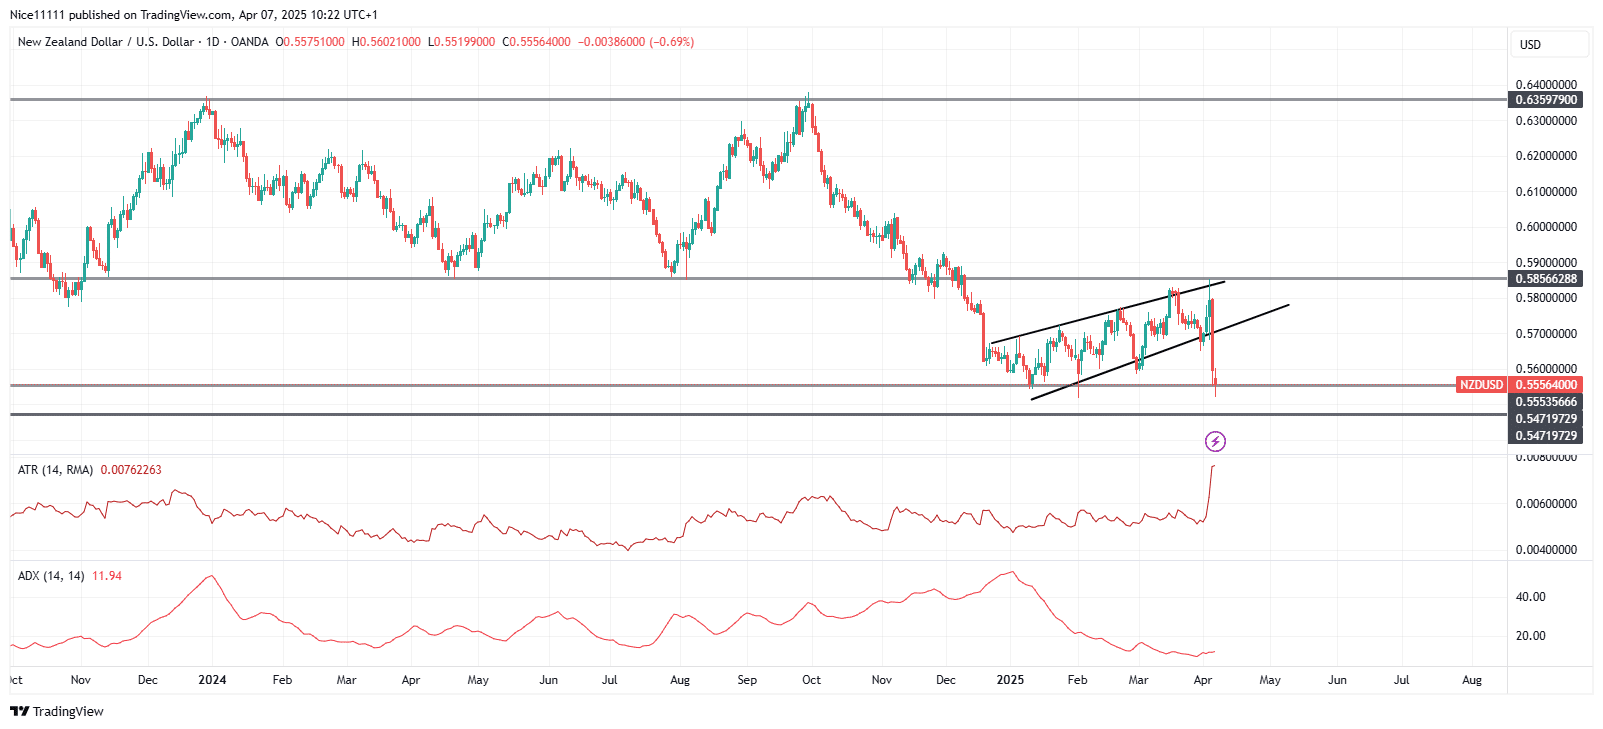
The NZDUSD currency pair has broken through the long-term support level of 0.5860, triggering a significant price drop to the next support level at 0.5550. This move was followed by a brief pullback, which retested the previously broken support level of 0.5860. However, sellers quickly regained control, driving the price down to 0.5550 in a single, decisive move.
The bearish trend in the NZDUSD pair began in October, following the formation of a swing high at the 0.6360 resistance zone. This marked a turning point in the market, with sellers gaining the upper hand.
.
The short-term price decline has been characterized by a strong downward trend. The Average Directional Index (ADX) rose significantly from October to December, indicating a growing trend. However, upon reaching the support level of 0.5560, the market transitioned into a correction phase.
.
This correction phase, which began in January, persisted until April and formed a bullish channel. Nevertheless, the retest of the broken support level at 0.5860 led to
resistance, ultimately resulting in a price crash.
NZDUSD Short-term Trend: Bearish
The bearish breakout from the bullish channel was marked by aggressive selling. A large bearish candle highlighted the wide range of trades in a single day, causing the Average True Range (ATR) indicator to rise. This indicates an increase in market volatility. The price has currently reached 0.5560, and we anticipate a further decline to the next support level at 0.5470.
Trade on MT4 with Leverage up to 1:500! Trade on MT4 with Leverage up to 1:500!
X
We use cookies to ensure that we give you the best experience on our website. If you continue to use this site we will assume that you are happy with it.

 NZDUSD Short-term Trend: Bearish
 NZDUSD Short-term Trend: Bearish


