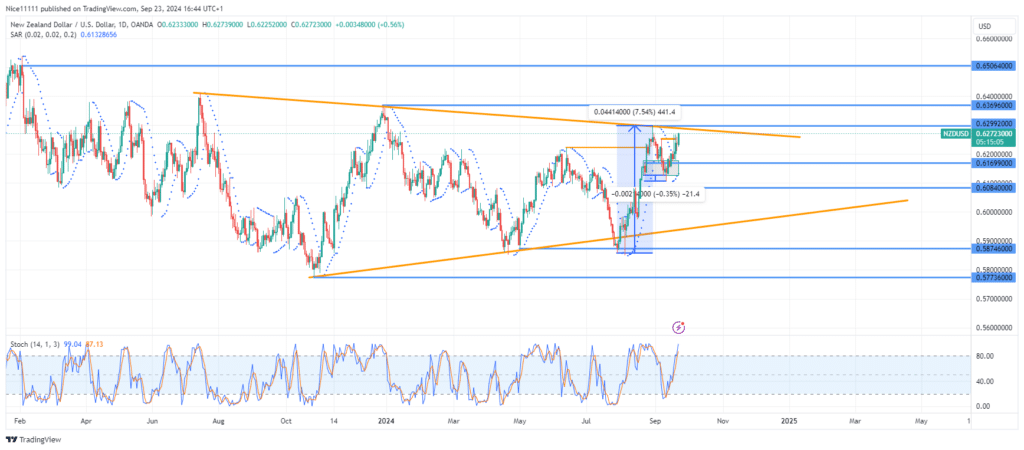
NZDUSD is currently characterized by a symmetrical triangle pattern by the price action on the daily chart, defined by lower highs and higher lows. The last encounter with the resistance trendline led to a price drop, but the bulls have quickly recovered, setting up for another attempt to break through the resistance.
The bullish trend for NZDUSD began with a reversal at 0.58750. On July 29, the price touched a bullish trendline, sparking a shift in momentum. This upward movement led to a 7.54% gain before encountering the descending resistance trendline, which caused a sharp pullback below the bullish order block at 0.61700.
The bulls regained control, despite a dip of 21 pips below the order block. The market is now positioned for a renewed attack on the resistance trendline.
NZDUSD Short-Term Trend: Bullish
On the 4-hour chart, a bullish trend has taken shape. The price action has formed higher highs and higher lows, which are well aligned along a trendline. This move has pushed the price above the 0.62580 resistance level on lower timeframes. The Parabolic SAR (Stop and Reverse) indicator supports this upward movement. It points appears beneath the daily candles across both higher and lower timeframes.
The Stochastic indicator shows oversold signals on both timeframes. This calls for the need for careful observation of the market structure to identify the best forex signals telegram channels can offer.
Trade on MT4 with Leverage up to 1:500! Trade on MT4 with Leverage up to 1:500!
X
We use cookies to ensure that we give you the best experience on our website. If you continue to use this site we will assume that you are happy with it.

 NZDUSD Short-Term Trend: Bullish
 NZDUSD Short-Term Trend: Bullish


