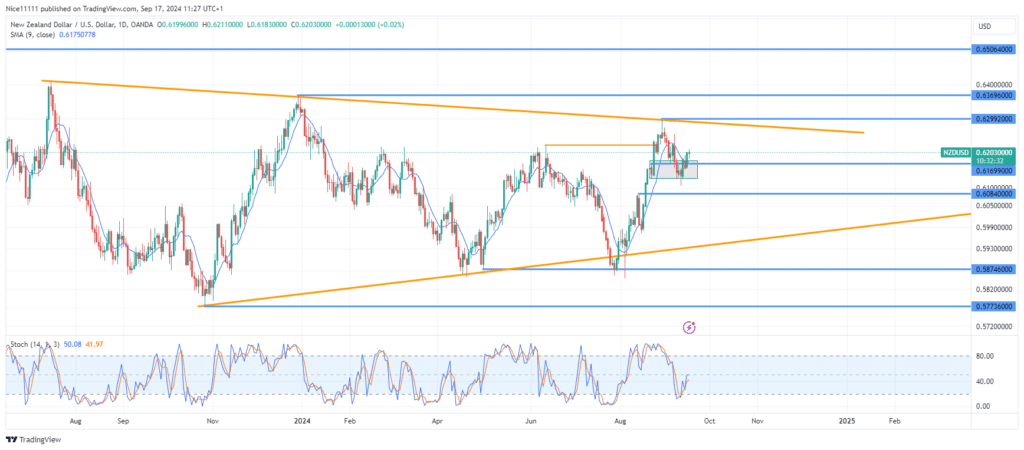
The NZDUSD pair encountered resistance after testing a bearish trendline anchored on multiple swing highs on the daily chart. Price action pulled back to a key bullish order block at 0.6170, and a bullish market structure is now visible on the 4-hour chart, fueling the current price rally.
Since August’s bullish break of structure on the daily chart, NZDUSD reached a resistance trendline, where the Stochastic indicator signalled overbought conditions. This triggered a price retracement, which is evident in the dip below the 9-period Moving Average. Although price initially bounced off the bullish order block, it briefly dipped further, which could signal a weakening support.
The Stochastic indicator shows that the market entered an oversold zone during the test of the order block, and the current rise reflects selling exhaustion, potentially setting the stage for further upward momentum.
NZDUSD Short-term Trend: Bullish
A bullish shift in market structure has formed on the 4-hour chart, supported by the 9-period Moving Average. This setup, combined with a Change of Character (ChoCh) on the lower timeframes, offers a high-quality opportunity for potential forex signals. The Stochastic indicator aligns with this bullish momentum, confirming the market’s reversal from oversold conditions.
Trade on MT4 with Leverage up to 1:500! Trade on MT4 with Leverage up to 1:500!
X
We use cookies to ensure that we give you the best experience on our website. If you continue to use this site we will assume that you are happy with it.

 NZDUSD Short-term Trend: Bullish
 NZDUSD Short-term Trend: Bullish


