Key Resistance Levels: 0.7000, 0.7200, 0.7400
Key Support Levels: 0.6200, 0.6000, 0.5800
NZD/USD Price Long-term Trend: Bullish
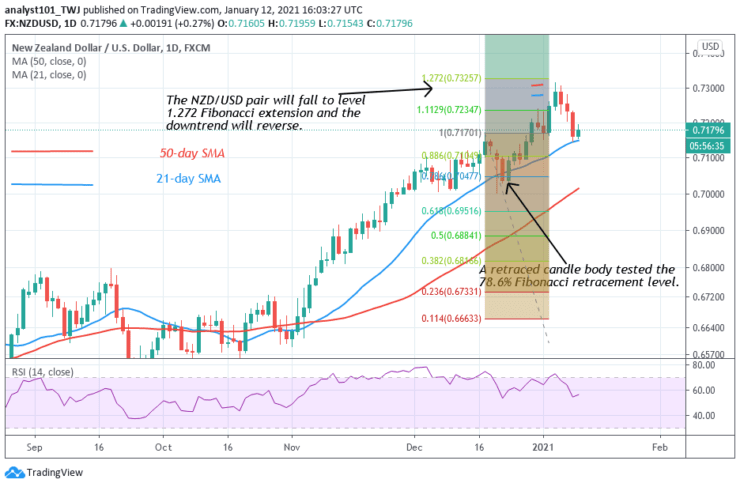
The Kiwi is in an uptrend. From the price action, the Kiwi reached a high of level 0.7315 and reversed. The Fibonacci tool analysis has confirmed the reversal. The Fibonacci tool indicated that the market will reverse at level 1.272 Fibonacci extension or 0.7325. The price will retrace to the 78.6% Fibonacci retracement level where it originated. A fresh uptrend is likely to resume.
Daily Chart Indicators Reading:
The Kiwi has fallen to level 56 of the Relative Strength Index period 14. It indicates that the pair is in the uptrend zone. The 50-day SMA and 21-day SMA are sloping upwardly indicating the uptrend.
NZD/USD Medium-term Trend: Bearish
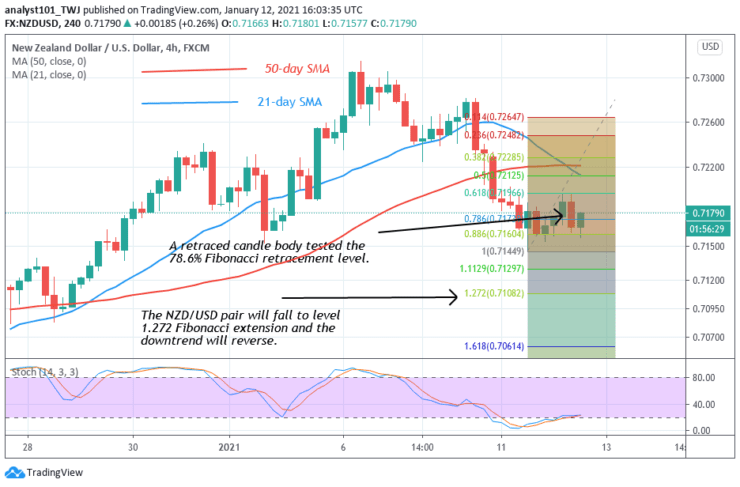
On the 4-hour chart, the NZD/USD pair is now in a downtrend. On January 11 downtrend; a retraced candle body tested 78.6% Fibonacci retracement level. The retracement indicates that the pair will fall to level 1.272 Fibonacci extension. That is a low of level 0.7108.
4-hour Chart Indicators Reading
The 50-day and 21-day SMAs are sloping upward. It indicates the previous uptrend. The Kiwi is below the 40% range of the daily stochastic. It indicates that the market is in a bullish momentum.
General Outlook for NZD/USD
The NZD/USD pair has retraced enough to resume an upward move. According to Fibonacci tool analysis, the pair will fall to level 1.272 or 0.7108 low.
Note: Learn2.Trade is not a financial advisor. Do your research before investing your funds in any financial asset or presented product or event. We are not responsible for your investing results
- Broker
- Min Deposit
- Score
- Visit Broker

- Award-winning Cryptocurrency trading platform
- $100 minimum deposit,
- FCA & Cysec regulated

- 20% welcome bonus of upto $10,000
- Minimum deposit $100
- Verify your account before the bonus is credited
- Fund Moneta Markets account with a minimum of $250
- Opt in using the form to claim your 50% deposit bonus
Learn to Trade
Never Miss A Trade Again

Signal Notification
Real-time signal notifications whenever a signal is opened, closes or Updated

Get Alerts
Immediate alerts to your email and mobile phone.

Entry Price Levels
Entry price level for every signal Just choose one of our Top Brokers in the list above to get all this free.