Don’t invest unless you’re prepared to lose all the money you invest. This is a high-risk investment and you are unlikely to be protected if something goes wrong. Take 2 minutes to learn more
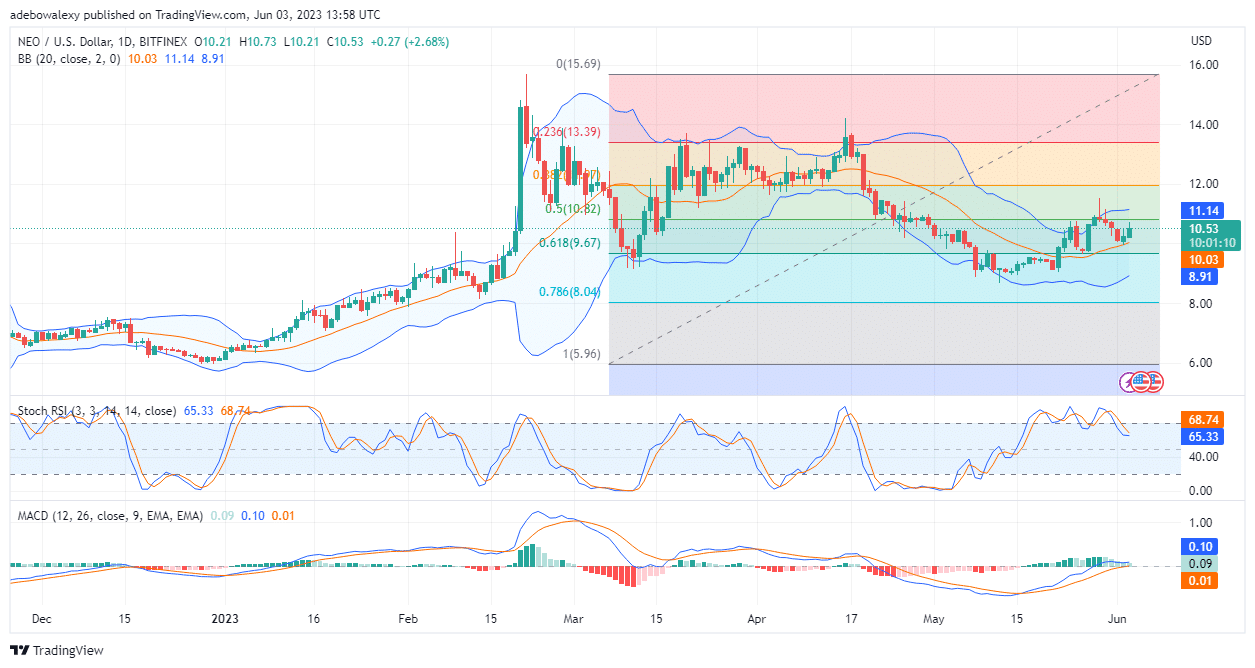
Recently, price action in the NEO/USD market bounced off the resistance near the $10.97 mark. A downward retracement towards the $10.00 mark followed the rebound before buyers regained control of price action. Since the just concluded trading session, prices have started moving towards $11.00. Let’s see how price action may fare shortly.
NEO Analysis Data
NEO Value Now: $10.53
NEO Market Cap: $747,899,805
NEO Moving Supply: 70,538,831 NEO
NEO Total Supply: 100,000,000 NEO
NEO CoinMarketCap Ranking: 61
Major Price Levels:
Top: $10.53, $11.00, and $11.50
Base: $10.13, $9.80, and $9.50

NEO/USD Extends Its Course Towards the $11.00 Mark
In the previous session, price action in the NEO/USD market bounced off the support at the $10.03 mark. Furthermore, the ongoing session has shown the readiness of buyers to keep pushing prices higher. Another green rice candle has shown up on the NEO daily chart. Consequently, this has pushed prices to $10.53. Despite the recent downward retracement, the Relative Strength Index (RSI) indicator has started trending downward. The most recent gain in bullish momentum seems to have stimulated a bullish reveal move on the RSI, as the lines of the indicator are now converging for a crossover. If buying momentum continues to grow, the crossover will occur, and a continued upside retracement will occur.

NEO/USD Runs Into Gridlock, Yet Retains Upside Potential
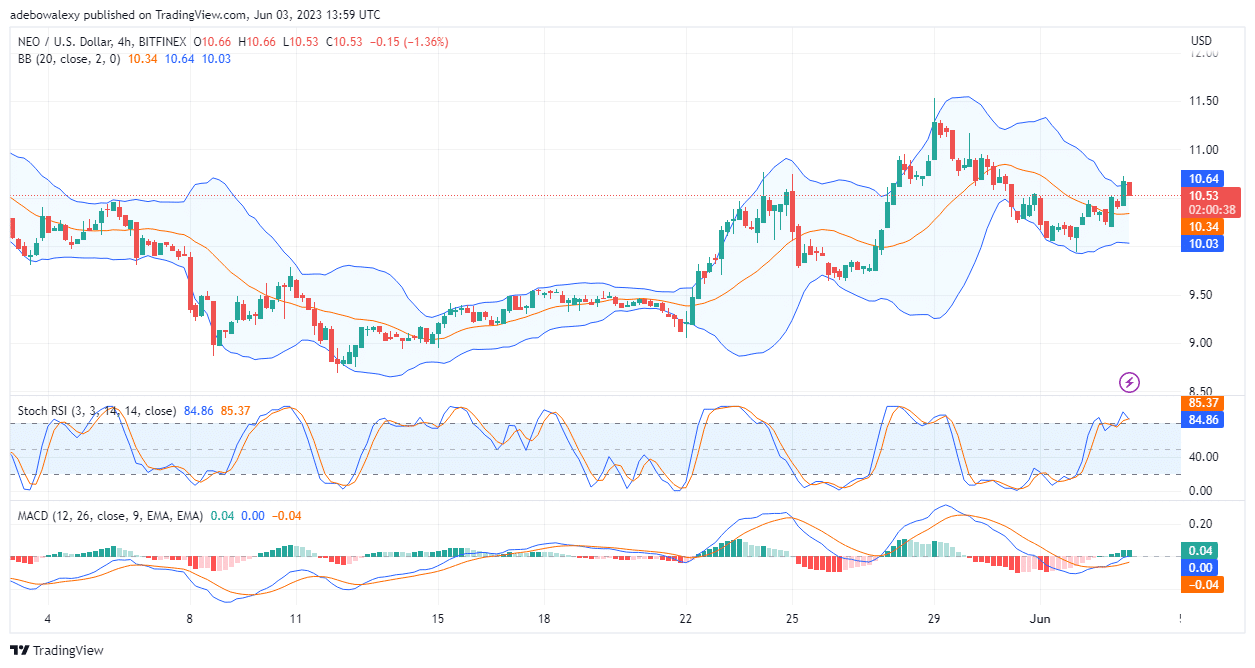
In the NEO/USD 1-hour market, it could be seen that price action seems to have hit a blockade at the $10.64 price mark. Price activities had reacted with a minimal downward retracement. Nevertheless, there are possibilities that prices may continue on their upward path in this market. It could be seen that the previous session gathered a significant amount of profit considering the size of the price candle that represents it. Also, the losses incurred in the ongoing session haven’t canceled out all the profits from the previous trading session. In addition, the Moving Average Convergence Divergence indicator (MACD) curve keeps moving upwards, while its bars continue to appear green. Therefore, it appears that the price is largely focused on hitting the $11.00 mark.
- Broker
- Min Deposit
- Score
- Visit Broker
- Award-winning Cryptocurrency trading platform
- $100 minimum deposit,
- FCA & Cysec regulated
- 20% welcome bonus of upto $10,000
- Minimum deposit $100
- Verify your account before the bonus is credited
- Fund Moneta Markets account with a minimum of $250
- Opt in using the form to claim your 50% deposit bonus
Learn to Trade
Never Miss A Trade Again

Signal Notification
Real-time signal notifications whenever a signal is opened, closes or Updated

Get Alerts
Immediate alerts to your email and mobile phone.

Entry Price Levels
Entry price level for every signal Just choose one of our Top Brokers in the list above to get all this free.


