NEO Price Analysis – October 12
The ability to break up the two dynamic resistance level will place the price at the resistance level of $19, in case the level is penetrated upside, then, NEO will be exposed to the $22 price level, above it is found a significant level of $25.
NEO/USD Market
Key Levels:
Resistance levels: $19, $22, $25
Support levels: $16, $14, $12
NEO/USD Long-term Trend – Bearish
NEO/USD is bearish in the daily chart. NEO reached the support level of $16 as it was predicted last week. Also, the level stands as a bullish reversal zone. The price was rejected at the support level of $16 on October 07 with the formation of bullish candles. A pin bar was formed at the support level of $16 which is a bullish reversal candle pattern. The price is testing the dynamic resistance levels at moment.
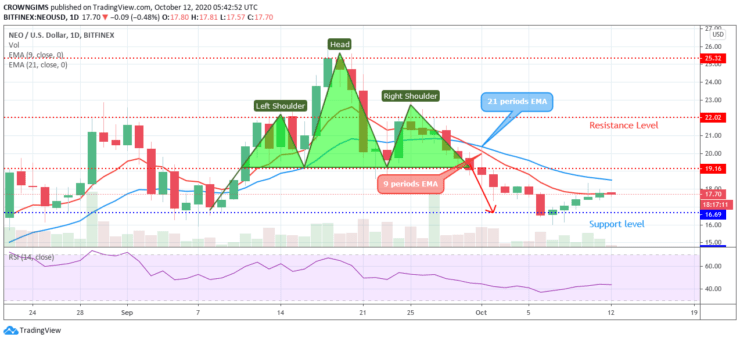
The crypto is trying to break up the 9 periods EMA while 21 periods EMA is above the two. The ability to break up the two dynamic resistance level will place the price at the resistance level of $19, in case the level is penetrated upside, then, NEO will be exposed to the $22 price level, above it is found a significant level of $25. If the price could not penetrate the confluence at $19 level, it may reverse and face the support levels at $16, $14, and $12. The Relative Strength Index period 14 is above 40 levels pointing up which connote buy signal.
NEO/USD Medium-term Trend – Bullish
The buyers are gradually taking over the NEO Market. The price tested the support level of $16 but unable to break down the level. At the same support level, a bullish engulfing candle emerges and the price follows the bullish reversal signal. NEO is heading toward the $19 price level.
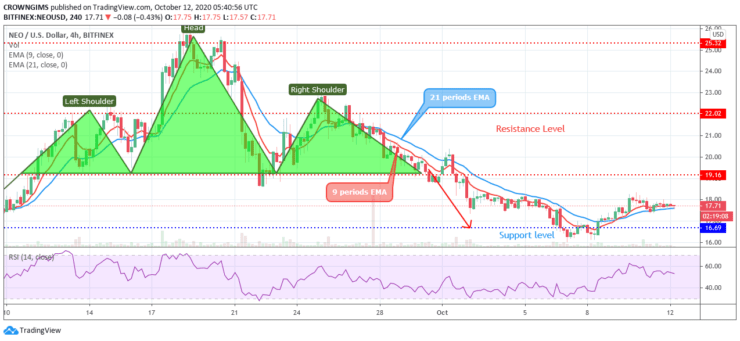
The Crypto is trading directly in contact with the two EMAs and the two are close to each other which indicates low momentum in the NEO market. However, the relative strength index period 14 is at 50 levels bending down to indicate a sell signal which may be a pullback.
- Broker
- Min Deposit
- Score
- Visit Broker

- Award-winning Cryptocurrency trading platform
- $100 minimum deposit,
- FCA & Cysec regulated

- 20% welcome bonus of upto $10,000
- Minimum deposit $100
- Verify your account before the bonus is credited
- Fund Moneta Markets account with a minimum of $250
- Opt in using the form to claim your 50% deposit bonus
Learn to Trade
Never Miss A Trade Again

Signal Notification
Real-time signal notifications whenever a signal is opened, closes or Updated

Get Alerts
Immediate alerts to your email and mobile phone.

Entry Price Levels
Entry price level for every signal Just choose one of our Top Brokers in the list above to get all this free.