NEO Price Analysis – October 05
NEO is approaching a potential bullish reversal zone; the rejection of the price at the $16 support level may be a price reversal towards the resistance level of $19, $22, and $25. In case the support level of $16 does not hold, the price may reduce to $14 and $12 support level.
NEO/USD Market
Key Levels:
Resistance levels: $19, $22, $25
Support levels: $16, $14, $12
NEO/USD Long-term Trend – Bearish
The bears maintain their pressure in the NEO/USD market. The price is obeying the command of the chart pattern formed last week (Head and Shoulder pattern). The former support level of $19 has turned to a resistance level after the breaking of the level by the bears’ pressure. Yesterday, NEO pulled back and gain 1.2%.
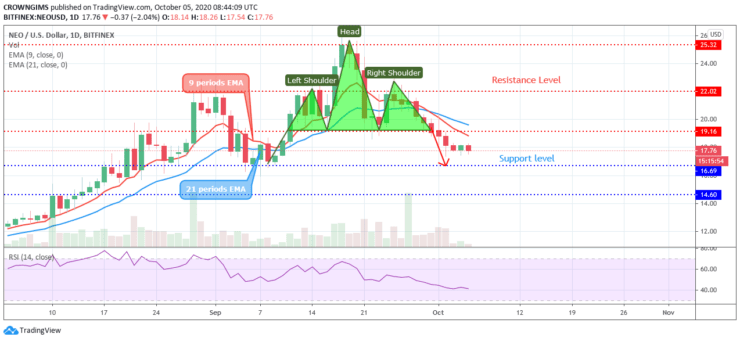
Today, the crypto is continuing its bearish movement targeting the support level of $16. The 21 periods EMA remains above the 9 periods EMA while the price is trading below the later EMA; an indication of bearish momentum. NEO is approaching a potential bullish reversal zone; the rejection of the price at the $16 support level may be a price reversal towards the resistance level of $19, $22, and $25. In case the support level of $16 does not hold, the price may reduce to $14 and $12 support level.
NEO/USD Medium-term Trend – bearish
The sellers dominate the NEO market in the 4-hour chart. That means NEO/USD is under the bearish momentum. Further price reduction is envisaged as the $19 price level has been penetrated downside and it is moving down towards the $16 demand level.
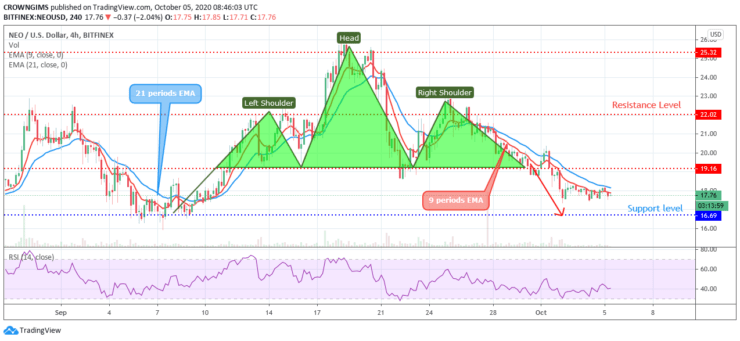
The two EMAs are at distance to each other and the price is trading below the 9 periods EMA and 21 periods EMA as a sign of an increase in the bears’ momentum. The Relative Strength Index (14) on the 4-hour chart is at 40-level bending down which reveals that the bears may continue to hold the market. The price may reduce to the demand level at $16.
- Broker
- Min Deposit
- Score
- Visit Broker

- Award-winning Cryptocurrency trading platform
- $100 minimum deposit,
- FCA & Cysec regulated

- 20% welcome bonus of upto $10,000
- Minimum deposit $100
- Verify your account before the bonus is credited
- Fund Moneta Markets account with a minimum of $250
- Opt in using the form to claim your 50% deposit bonus
Learn to Trade
Never Miss A Trade Again

Signal Notification
Real-time signal notifications whenever a signal is opened, closes or Updated

Get Alerts
Immediate alerts to your email and mobile phone.

Entry Price Levels
Entry price level for every signal Just choose one of our Top Brokers in the list above to get all this free.